Since the functions of biological materials are closely related to the presence of hydrogen atoms and water molecules, it is important to determine the hydrogen positions in proteins and nucleic acids. While it is difficult to detect the hydrogen atoms by X-ray crystallography, neutron diffraction is a very powerful method by which to determine detailed structures, including hydration and hydrogen positions. However, the neutron diffraction method requires a single crystal larger than 1 mm3.
We have succeeded in developing the growth conditions for large crystals of biological materials through analysis of their solubility phase diagrams. The phase diagram method offers the following advantages: (1) It becomes easy to establish the best conditions for crystal growth. (2) It facilitates selection of the best method of crystallization. (3) The reproducibility of crystallization experiments is improved.
Nevertheless, only a few papers have been reported on the exact phase diagrams which are required for making large single crystals.
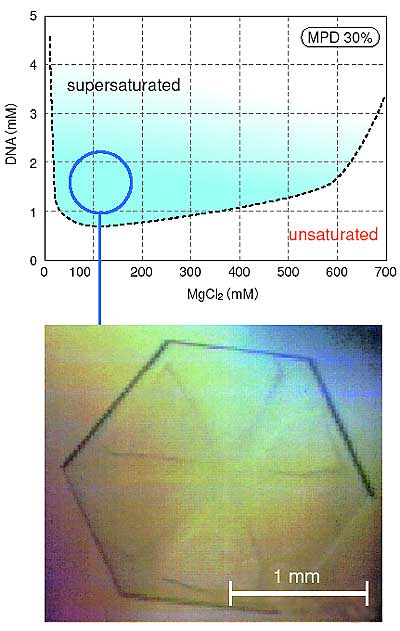
Fig. 4-15 shows a phase diagram obtained by control of the B-DNA d(CCATTAATGG) and MgCl2 concentrations in the presence of MPD (30%:v/v). We found that the best conditions for crystallization were located around the minimum solubility point of the oligonucleotide. Under these conditions a large single crystal (2.0x2.0x0.3 mm) has been successfully grown.
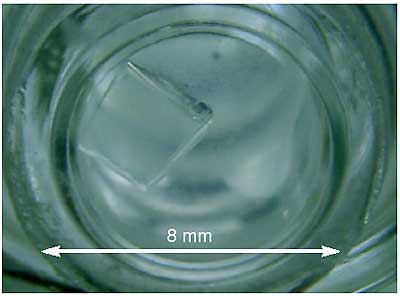
In the same way, we have succeeded in making a large single crystal (4.0x4.0x1.3 mm) of insulin using the phase diagram technique (Fig. 4-16).
These crystals are suitable for neutron diffraction analysis, and the collection of a complete data set of Bragg reflections is presently scheduled. This technology can also be applied to the growth of good quality crystals for high resolution X-ray diffraction analysis. |