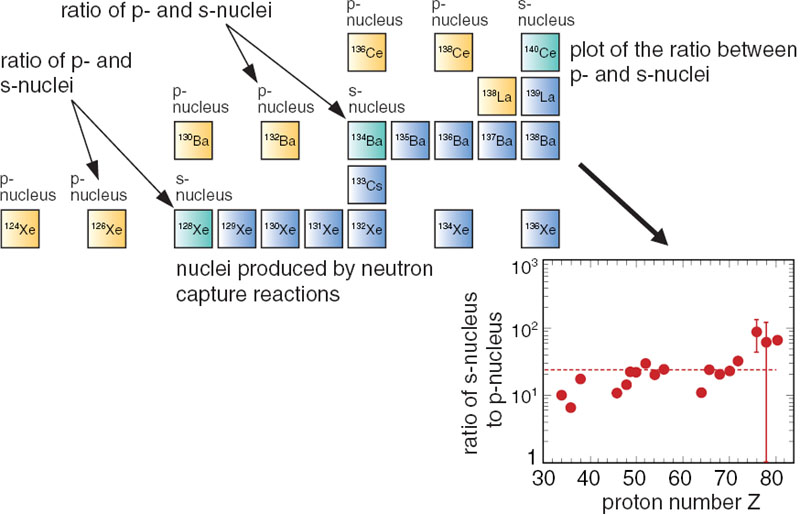
| Fig. 5-3 | Partial nuclear chart in the Ba region and the discovery of an empirical law The nuclear chart is presented in left side. The Y-axis is the proton number and X is the neutron number. The elements of Ba and Xe have pairs of s- and p-nuclei. The origin of the p-nuclei has been an open problem. There are eighteen pairs of the p- and s-nuclei. Plotting the abundance ratio of the s-nucleus to the p-nucleus, we find the ratio is almost constant (see right side). |
| Go back by your web browser, or click the right button. |  |
| Persistent Quest Research Activities 2005 Copyright (C) Japan Atomic Energy Research Institute |