Publication Date: February 13, 2026
Access counts:0
Demonstration of Radioactivity Contamination Visualization Using an integrated Radiation Imaging System
-A Case Around the Starting Transformer of Unit 3 at the Fukushima Daiichi Nuclear Power Station-
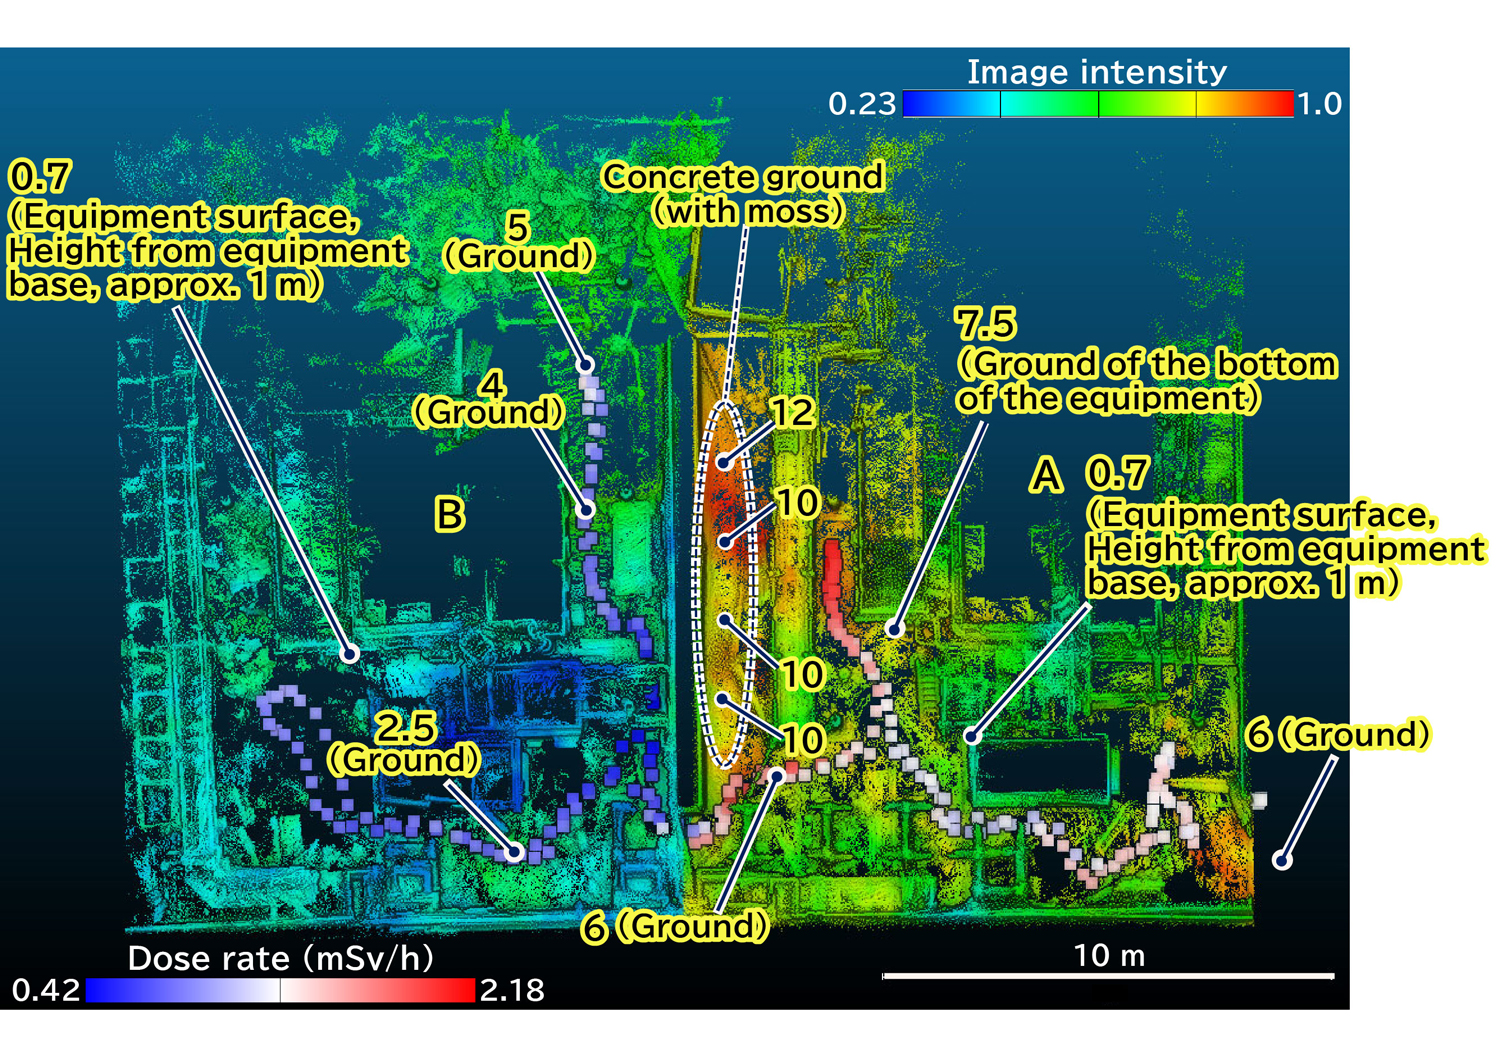
Fig. 1 3D model data visualizing areas of high radioactive contamination and dose rates around the startup transformer for Unit 3 of 1F
Fourteen years and six months have passed since the TEPCO’s Fukushima Daiichi Nuclear Power Station (1F) accident, but as high-radiation areas still remain, it is difficult for workers to access and work within the 1F site for extended periods. Assessment of the distribution of radioactive contamination and dose rates within this work environment is essential in order to minimize worker exposure and inform the development of effective work plans.
Therefore, the Japan Atomic Energy Agency has developed an integrated Radiation Imaging System (iRIS) to visualize radioactive contamination distribution in 3D and is currently conducting demonstration tests *. This system visualizes radioactive contamination distribution—including hot spots—by projecting 3D imaging data of contamination acquired from multiple perspectives using a gamma-ray imager onto the 3D structural data of the work environment obtained through environmental perception devices.
Figure 1 shows the results of the demonstration test conducted in collaboration with Tokyo Electric Power Company Holdings, Inc. (TEPCO) around the startup transformer for Unit 3. A survey of the radioactive contamination distribution was conducted using iRIS, which consists of a Compton camera, SLAM (Simultaneous Localization and Mapping) device, and a survey meter. The results confirmed that radioactive contamination is mainly deposited in the soil and concrete ground. At the same time, dose rate was also confirmed to increase in areas where high concentrations of radioactive contamination are deposited. Furthermore, discussions regarding the correlation between the reconstructed image intensity of radioactive contamination and surface dose rate are ongoing.
Regarding iRIS, we are also continuing surveys of high-dose rate areas within the 1F buildings that are difficult for workers to access by combining it with robots, and we will continue to contribute to environmental improvement both inside and outside the 1F site.
*Japan Atomic Energy Agency, "Visualization" of Radioactive Contamination at the Decommissioning Site on a 3D Map —Understanding Invisible Radioactive Contamination in a Virtual Space and Reducing Worker Exposure—, May 14, 2021, Press release.

If you have any comments or feedback about this page, please click the button to share your thoughts with us.