Publication Date: November 7, 2025
Access counts:0
Integrated Radiation Air Dose Rate Maps After Fukushima Daiichi Nuclear Power Plant Accident
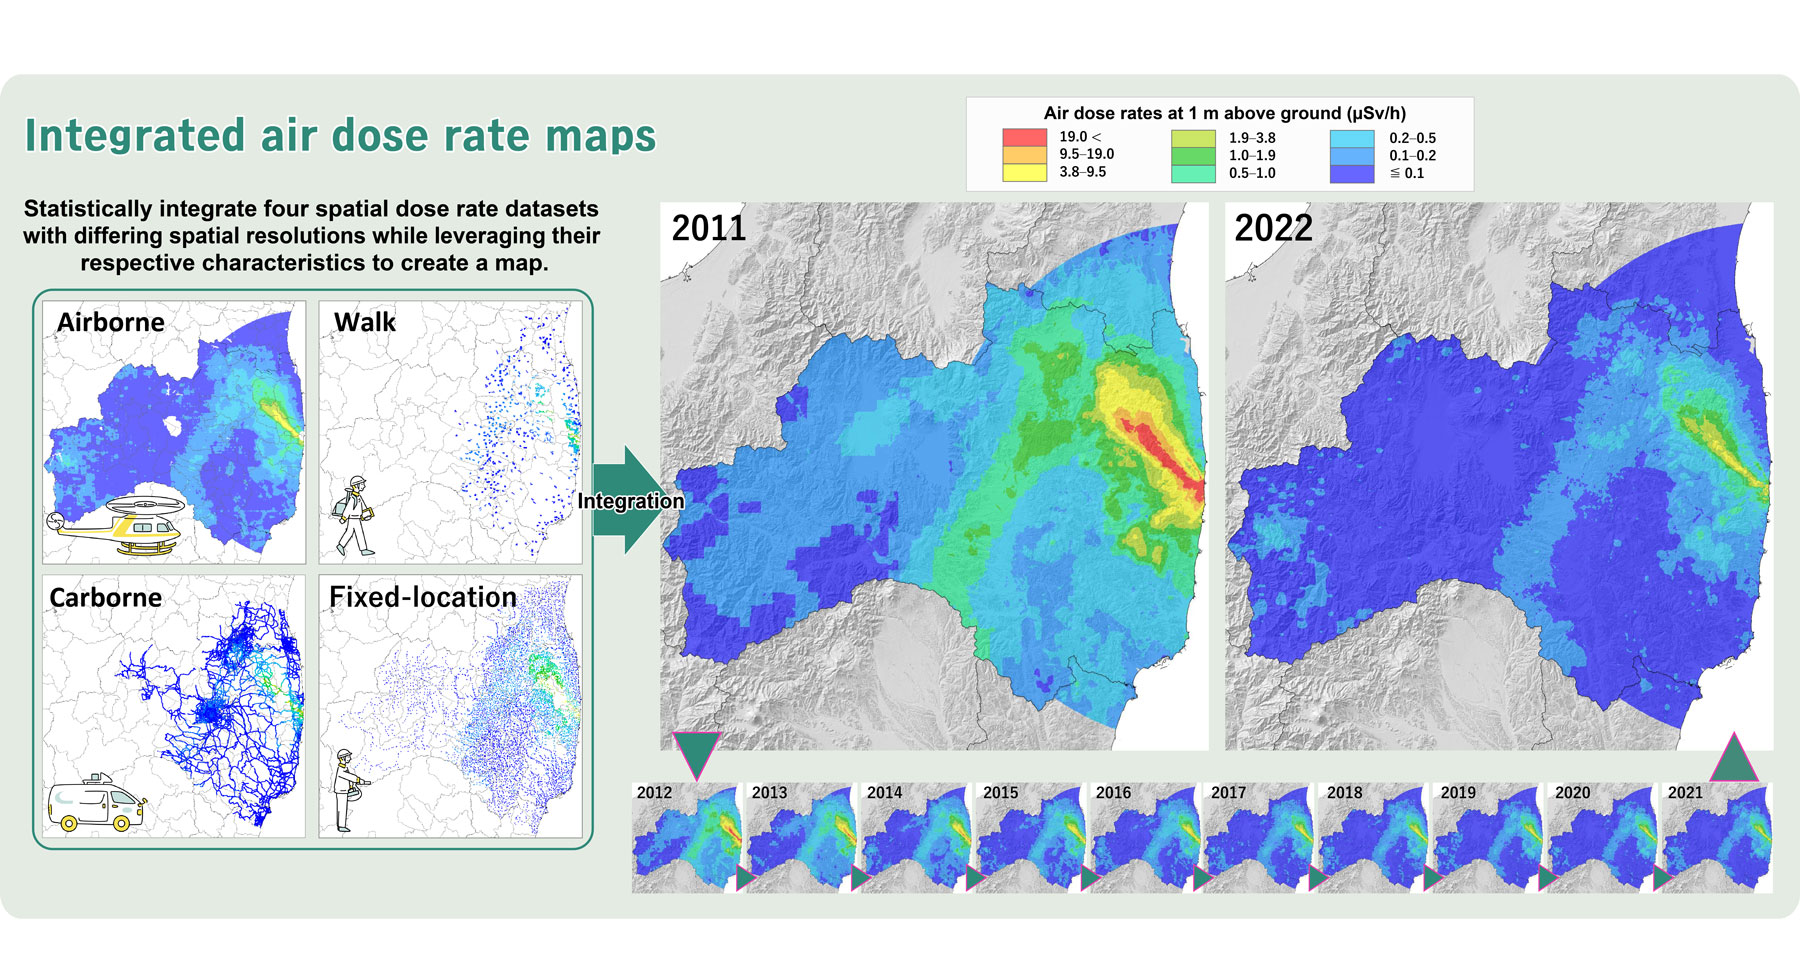
Fig. 1 Integrated maps of air dose rates over the 80 km radius of the 1F and the entire Fukushima Prefecture during 2011–2022
Following the accident at the Tokyo Electric Power Company Fukushima Daiichi Nuclear Power Station (1F), measurements have been conducted in various regions using different methods to assess air dose rates. However, while air-borne surveys provide an overall picture, they measure from above, and thus the values for the spatial air dose rates at 1 meter above ground contain some degree of uncertainty. Conversely, while walk surveys and fixed-location measurements at ground level offer high precision, data exists only for the specific measurement points.
Wainwright et al. (2017*1, 2019*2) established a method using Bayesian geostatistics to integrate measurement results from multiple types of surveys, including air-borne surveys, car-borne surveys, walk surveys, and fixed-location measurements. Therefore, this study extended that method to enable its application over a wide area, creating an integrated spatial dose rate map for the Fukushima region at 50 m resolution, covering the period from 2011 to 2022. This was applied to areas within an 80 km radius of the 1F and over Fukushima Prefecture, taking into account areas where evacuation orders had been lifted. The integrated map fixed the bias to underestimate spatial dose rates in forested areas and created a more extensive and reproducible map covering multiple years compared to previous studies.
The results of this study are expected to be used for detailed exposure assessments for the general public. Furthermore, the integrated map data is available in the JAEA repository (https://doi.org/10.60427/0002000022).
*1 Wainwright, H. M. et al., A Multiscale Bayesian Data Integration Approach for Mapping Air Dose Rates Around the Fukushima Daiichi Nuclear Power Plant, Journal of Environmental Radioactivity, vol.167, 2017, p.62–69.
*2 Wainwright, H. M. et al., Characterizing Regional-Scale Temporal Evolution of Air Dose Rates After the Fukushima Daiichi Nuclear Power Plant Accident, Journal of Environmental Radioactivity, vol.210, 2019, 105808, 8p.

If you have any comments or feedback about this page, please click the button to share your thoughts with us.