Publication Date: March 11, 2026
Access counts:0
Predicting the Effects of Decontamination Through Simulation
-Visualizing Decontamination Effects-
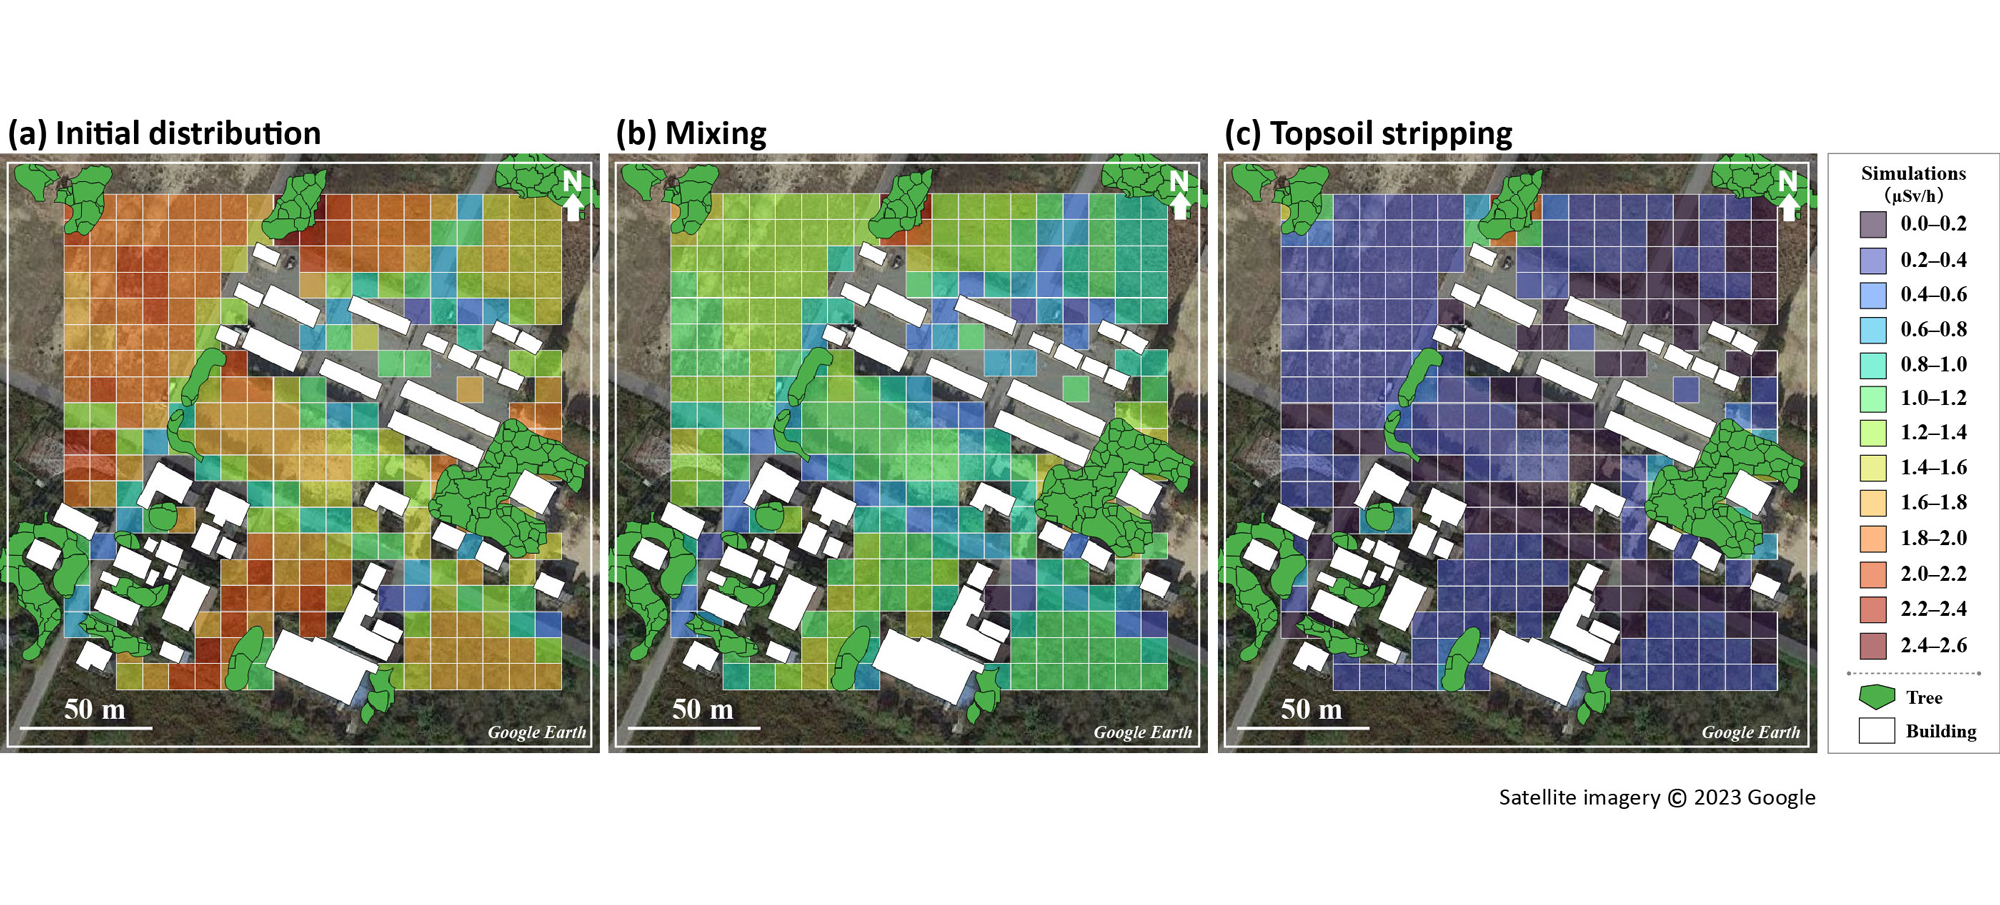
Fig. 1 Changes in the air dose rate distribution due to decontamination and cultivation: (a) Initial distribution, (b) Mixing, and (c) Topsoil stripping
Results from 10 m × 10 m tally regions with more than 50 % overlap by area. Building structures are excluded from the analysis.
After the TEPCO's Fukushima Daiichi Nuclear Power Station accident, understanding air dose rates in contaminated areas was essential to assess radiation exposure risks and plan decontamination. However, accurate evaluation is difficult due to topography, buildings, trees, and uneven radioactive depositions. To address this, JAEA and collaborators improved the 3D-ADRES (3D Air Dose Rate Evaluation System), which can reproduce three-dimensional dose distributions and simulate changes due to decontamination or cultivation.
In farming areas in Ōkuma Town, air dose rates decreased approximately 79 % by removing the topsoil, 86 % by adding clean soil after removal, 33 % by mixing only, and 83 % by mixing after decontamination (Fig. 1 a, b and c). From these results, 3D-ADRES was shown to be useful in the evaluation of decontamination methods and in the prediction of radiation exposure.
In the future, work focusing on dynamic and real-time dose evaluations, and validation of the obtained results in practice are planned.

If you have any comments or feedback about this page, please click the button to share your thoughts with us.