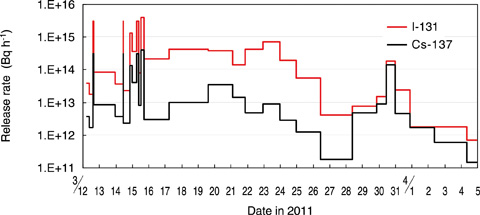
Fig.1-4 Estimation results of I-131 and Cs-137 release rates
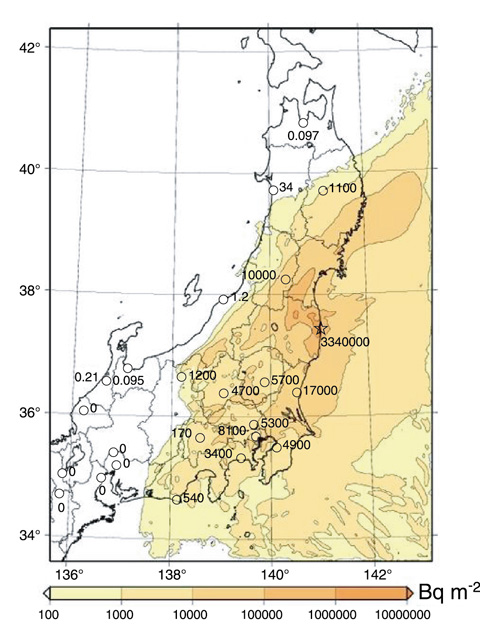
Fig.1-5 Surface deposition of Cs-137 over land in eastern Japan calculated using WSPEEDI
A significant amount of radionuclides were discharged into the atmosphere owing to the accident at the TEPCO’s Fukushima Daiichi NPS (1F) on March 2011. Evaluation of the effects of the accident on the environment and assessment of the radiological dose to the public is the urgent issue that needs to be addressed.
Since the accident at the 1F, we have continued to estimate the release amount to the atmosphere and analyze the atmospheric dispersion of radionuclides using the Worldwide version of System for Prediction of Environmental Emergency Dose Information, WSPEEDI. WSPEEDI provides accurate predictions of the atmospheric movements, dispersion, and deposition of radionuclides and the external exposed dose on a regional (approximately several 10 km) to a hemisphere scale.
By comparing the results of WSPEEDI simulations with environmental monitoring data, the rate of radionuclide release to the atmosphere was estimated. Fig.1-4 shows the temporal changes in the I-131 and Cs-137 release rates from March 12 to April 5, 2011. The increases in the release rates on March 12, 14, and 15 correspond to the plant events at the 1F, such as the hydrogen explosion of Unit 1 and Unit 3 and decreases in the reactor pressure in Unit 2. The release rate gradually decreased after March 23, implying that the damaged reactors became stable and the atmospheric release of radioactive materials was reduced.
Fig.1-5 illustrates the distribution of the surface deposition of Cs-137 accumulated from March 12 to April 1 calculated using WSPEEDI with use of the estimated release rate and meteorological data. A detailed analysis of the simulation results revealed that current areas of high surface deposition and dose rate were formed mainly as a result of dry deposition from March 15 to 16 and wet deposition from March 20 to 21.
The results of the present study were provided to the Nuclear Safety Commission of Japan and were used by the government in the Report of the Japanese Government to the IAEA Ministerial Conference on Nuclear Safety.
<Previous: 1 Research and Development Relating to the Accident at the TEPCO’s Fukushima Daiichi NPS | Next: 1-2 >

