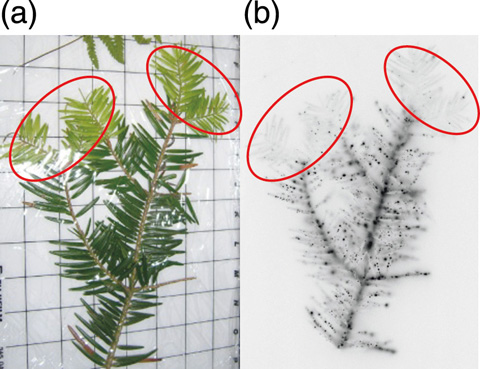
Fig.1-35 Autoradiograph image of Torreya nucifera
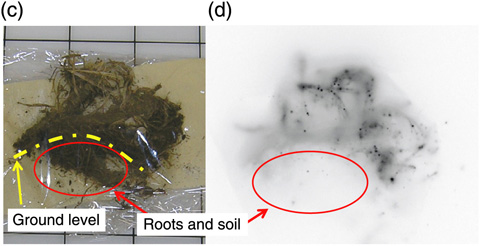
Fig.1-36 Autoradiograph image of meadow grass
How were radionuclides attached to and transported in forest plants and soil after fallout of radionuclides as a result of the accident at the TEPCO’s Fukushima Daiichi NPS. This question must be resolved to quantify present and future forest contamination. Distributions of radionuclides in plants and soil samples are usually measured by cutting small fractions from the samples. Unfortunately, this technique requires considerable time and effort. Thus, we have applied an autoradiography technique to analyze the distribution of radionuclides within the plants and soil.
We collected Torreya nucifera, Cryptomeria japonica, and soil in Iitate-mura, Soma-gun, Fukushima in May, 2011. We placed the samples on an imaging plate (IP) coated with fluorescent paint that reacts to radiation and photographed the spatial distribution of radionuclides.
The distribution of radionuclides in the branches and leaves of Torreya nucifera (Fig.1-35(a)) was analyzed by the autoradiograph image where many black spots were present (Fig.1-35(b)). These black spots appeared on the IP in response to radiation originating from radioactive Cs. Note that 131I was decayed out in May. Fig.1-35 (a) illustrates dark and light green leaves that grew before (old) and after (young) the accident, respectively. Black spots were present on the dark green leaves but not on the light green leaves, indicating that radionuclides attached to the old leaves were rarely transported to the young leaves. The same result was obtained from analysis of Cryptomeria japonica.
The autoradiograph image (Fig.1-36(d)) in roots and soil collected from the grass meadow (Fig.1-36(c)) shows many black spots on the leaves, but not in the roots and soil. This indicates that radioactive Cs is not transported from the leaves to the roots and that rain did not, in general, dissolve the radioactive Cs attached to the leaves to penetrate to the soil.
The samples used in the present study were collected two months after the accident at Fukushima. To study long-term change in forest contamination, we intend to collect samples continuously and analyze the long-term behavior of radioactive Cs attached to these plants.

