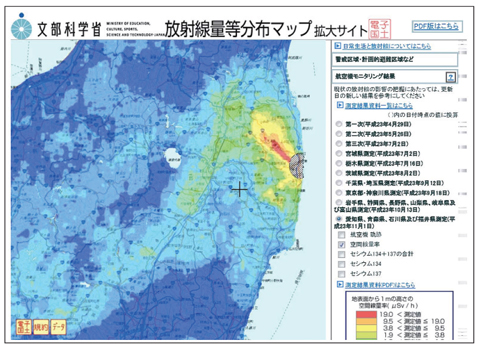
Fig.1-7 Radioactivity distribution map system
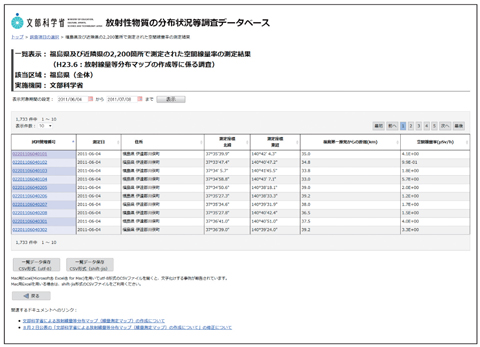
Fig.1-8 Radioactivity distribution database system
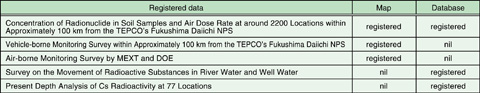
Table 1-1 Examples of registered data
JAEA has conducted extensive monitoring work to take appropriate measures against the environmental consequences of radionuclides released by the accident at the TEPCO’s Fukushima Daiichi Nuclear Power Station (NPS). Radioactivity distribution maps and database systems have been developed based on the results of this monitoring work.
The radioactivity distribution map system (Fig.1-7) provides visualization of the distribution of the dose rate in air and of radionuclide concentration in soil. A zooming-up function helps to check the distribution status of environmental radionuclides intuitively. The radioactivity database system (Fig.1-8) provides not only quantitative air dose rate and radionuclide concentration data but also detailed information relating to the measurement methods, analysis methods, precision of the measured data, and so on. Examples of registered data are shown in Table 1-1.
Before providing data to the public, access loads of both systems were evaluated through stress tests. It was found that the map system suffered from connection failure owing to heavy loads, because this system was designed to create a distribution map on demand according to user requests. To solve this problem, we redesigned the system to provide maps prepared in advance. Subsequently, the number of failures was reduced from 20% to 0.000001%. The map system was accessed by more than 300000 users over the first 10 days with no failures.
The most recent monitoring project has been in operation since June 2012. Environmental radioactivity data have continuously been collected and we intend to make these data available through maps and database systems.
This research project has been conducted as “The 1st and 2nd Study on Distribution of Radioactive Substances around the TEPCO’s Fukushima Daiichi Nuclear Power Station” funded by the Ministry of Education, Culture, Sports, Science and Technology (MEXT).

