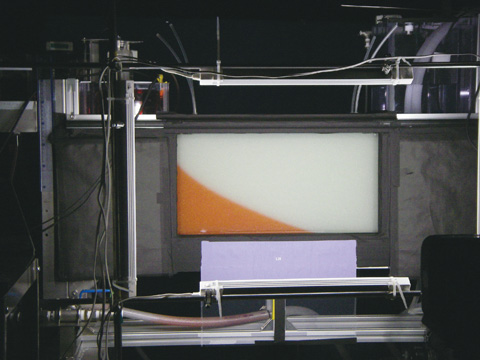
Fig.3-3 Optical measurement of salinity distribution
(e.g., saltwater intrusion)
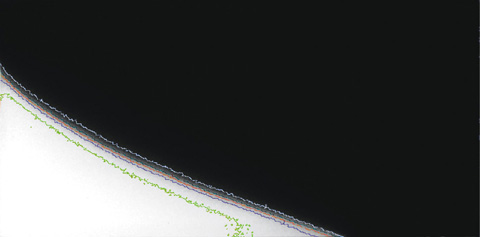
Fig.3-4 Experimental results for saltwater intrusion
(salinity distribution)
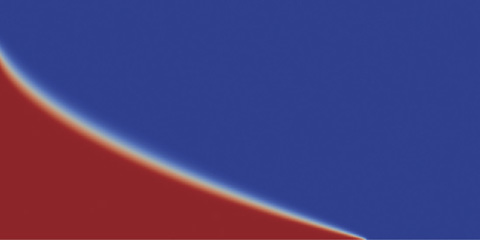
Fig.3-5 Simulation results for saltwater intrusion
(salinity distribution)
A safety assessment for the geological disposal of radioactive waste is based on the “groundwater scenario”, which assumes transportation of radioactive nuclides from a repository to the human living environment by groundwater. For the simulation of radionuclide migration, an appropriate model is selected on the basis of the characteristics of a target. For targets in coastal areas characterized by the coexistence of salt and fresh water, the parameters modeled include saltwater intrusion caused by the density difference, upconing of salt water with tunnel excavation, and change in the position of the salt-fresh water mixing zone as a result of sea level change. Although efforts have been made to understand these phenomena in situ, this understanding is limited owing to extremely complex groundwater flow and salinity distribution caused by heterogeneity in rock facies and fracture distribution. Consequently, numerical simulation coupling multiple phenomena consisting of advection, diffusion, and density flow is essential to complement in situ assessment.
To verify such groundwater simulation codes including “Dtransu”, we constructed experimental equipment incorporating a chamber filled with glass beads, which simulates a homogeneous media for saltwater intrusion, and an optical measurement device with a white LED light source and high-resolution CCD camera to observe salinity distribution (Fig.3-3). In the experiments, we measured the intensity of light reflected from the side surface of the salt water, which is colored with dye of sufficiently low concentration that acts as a tracer, using the optical device. We quantified the salinity distribution by applying the Kubelka-Munk formula to convert reflected light intensities into tracer concentrations (Fig.3-4). The optical measurement device can simultaneously quantify the salinity distribution and temporal variation for the entire section without disturbing the flow in the chamber. In addition, the spatial resolution of the measurement has been greatly improved.
At present, we are comparing the results of our experiments with those of numerical simulations (Fig.3-5) and verifying and upgrading the simulation codes. After improving the experimental techniques, we intend to study the phenomena of sea level change and upconing.
<Previous: 3 Research and Development on Geological Disposal of High-Level Radioactive Waste | Next: 3-2 >

