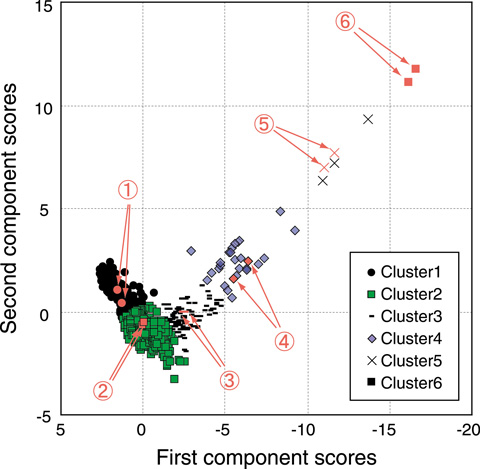
Fig.3-15 Scatter plot of the first and second component scores and clustering results
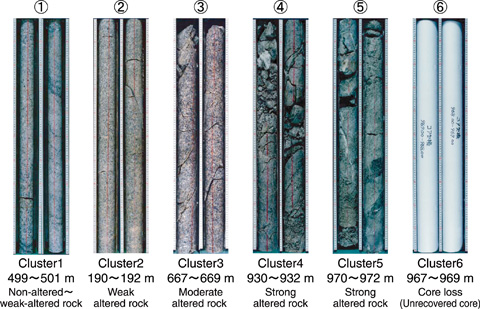
Fig.3-16 Borehole cores corresponding to the clusters
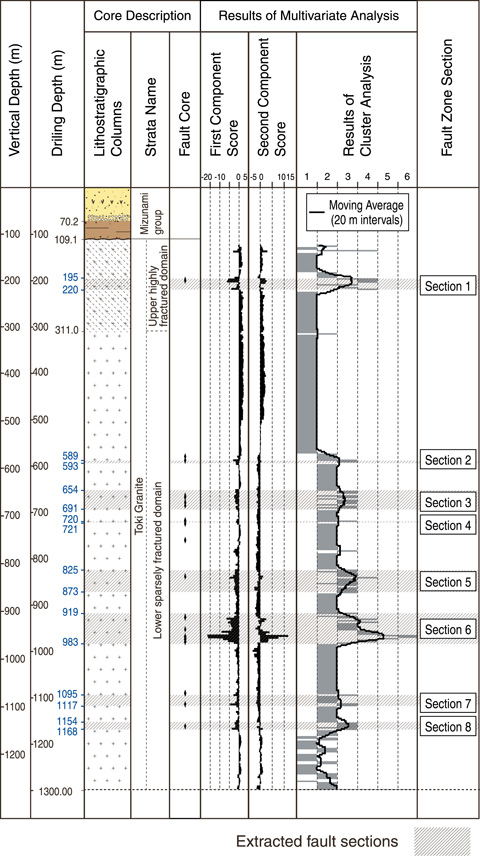
Fig.3-17 Fault sections in the borehole
A fault with a crush zone can strongly affect the mechanical, geochemical, and hydrological properties of a rock mass. Consequently, fault zone determination is treated as an essential element in evaluating the underground geological environment and the engineering performance of rocks. Nonetheless, the results may differ depending on the determination accuracy, because of the limited quantity and quality of geological data obtained, and/or depending on the geological knowledge and skill of the person in charge. As a case study for reducing such uncertainty, we tested a fault zone determination method (incorporating multivariate analysis composed of principal component analysis and clustering) on data from a deep borehole investigation in the Mizunami Underground Research Laboratory.
A 1300-m-long borehole, which encountered several fault zones, was selected for analysis. Quantitative data was acquired along the borehole by means of core description, geophysical logging, and a borehole TV. A principle component analysis, which enables the evaluation of correlations between data from different sources, was conducted; then, a scatter plot was produced with the first and second component scores clustered according to the k-means method (Fig.3-15). Fig.3-16 illustrates the rock conditions corresponding to the clusters in Fig.3-15. Because clusters 3∼6 have been identified as fault zones from the corresponding core descriptions, sections of these clusters were extracted as “fault” sections along the entire borehole (Fig.3-17). According to examination of the geological features of the extracted sections, the sections were accurately identified as fault zones (Fig.3-17). Thus, this method is assumed to be effective for fault zone determination and for providing useful geological and engineering information for 3-D geological modeling and groundwater flow analysis.
Our research was selected as an excellent research paper in Geoinformatics in 2011.

