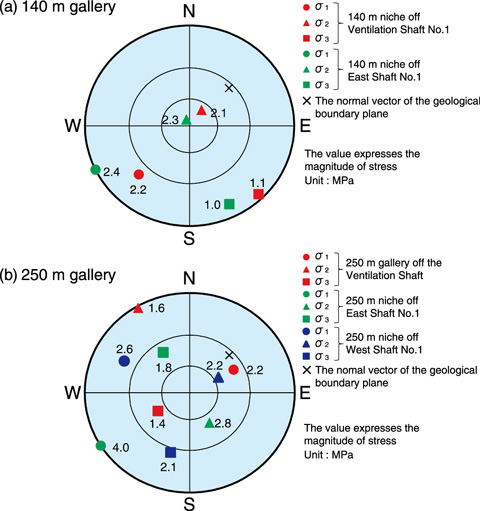
Fig.3-24 Lower hemisphere projection (Wulff net) of each principal stress in the 140 m and 250 m galleries
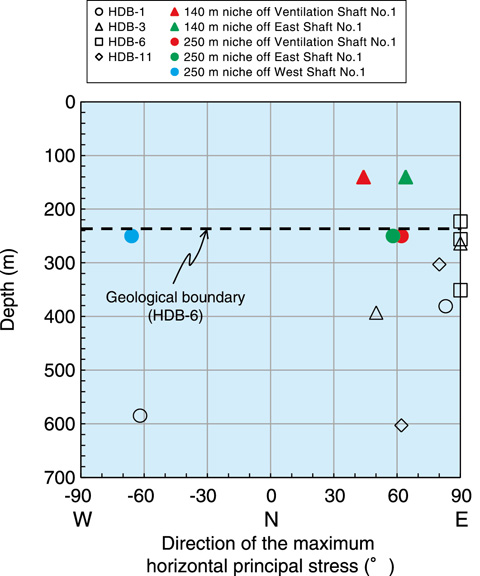
Fig.3-25 Depth distribution of the direction of the maximum horizontal principal stress
Information about initial stress distribution is important when designing the specifications of support members and the direction of drifts in an underground facility. In the Horonobe Underground Research Laboratory Project, the initial stress was measured by hydraulic fracturing using deep boreholes (520∼1020 m) in the surface-based investigation referred to as Phase 1. Each principal stress was obtained under the assumption that one of the principal stresses is along the borehole direction, i.e., the vertical direction. However, this assumption remains to be investigated, because the site is located in the vicinity of an anticline axis affected by folding deformation. To evaluate the initial stress obtained in Phase 1, spatial variation in initial stress was investigated by hydraulic fracturing at several depths in the underground laboratory. Measurements were conducted using three boreholes with different orientations at each measurement point, such that the characteristics, magnitudes, and directions of the three-dimensional principal stresses could be obtained without any assumptions regarding the directions of the principal stresses. Fig.3-24 illustrates the Wulff net projecting each principal stress in the 140 m and 250 m galleries. In the 140 m gallery, one of the principal stresses is close to the vertical direction and this was valid according to the assumptions of Phase 1. Conversely, even the principal stress closest to the vertical direction dipped at 35∼39° from the vertical direction in the 250 m gallery. Because the 250 m gallery is developed near a geological boundary, the distribution of the principal stress is probably affected by local factors. Fig.3-25 illustrates the direction of the maximum horizontal principal stress. The results of Phase 1 agreed with the results for the 140 m and 250 m galleries. Therefore, initial stress measurements from the surface of the ground may be used to evaluate the direction of the maximum horizontal principal stress correctly.
We intend to conduct initial stress measurements at different depths in order to elucidate the influence of geological structure and depth on the initial stress distribution.
<Previous: 3-8 | Next: 4 Nuclear Fusion Research and Development >

