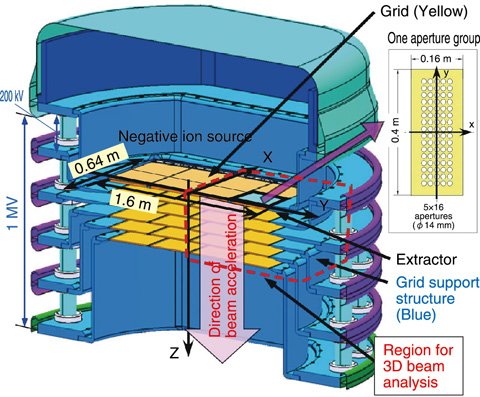
Fig.4-8 A cross section of the 1 MeV accelerator for the ITER NBI
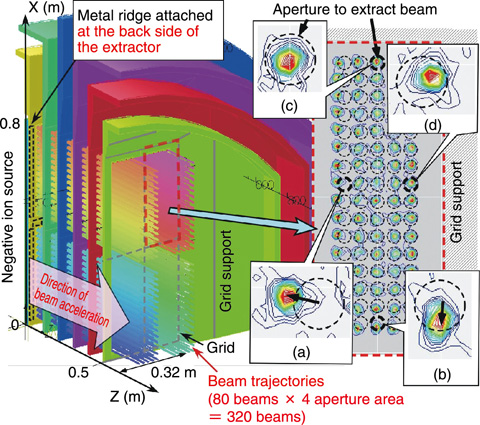
Fig.4-9 Deflection of 320 beams in 1/4 accelerator model
In the accelerator of the ITER neutral beam injector (NBI) shown in Fig.4-8, a deuterium negative ion (D-) beam of 1 MeV, 40 A is produced from a large extraction area of 0.64 × 1.6 m2 with 1280 apertures. However, the beam produced from each aperture is deflected owing to repulsion between beams having the same electric charge and because of electric field distortion formed by a grid support structure. The deflected beam directly hits grids and beamline components. Then excessive heat loads limit the pulse length. To compensate for these beam deflections, we have carried out a three-dimensional (3D) beam analysis.
The beam trajectory is much influenced by electric field distortions at low energy. Thus, a fine mesh is necessary to precisely calculate the electric field in the extractor. Because this requires a huge number of meshes and a large amount of computer memory, the number of beams in the calculation has been limited to five. To analyze many beams simultaneously, we developed the following technique: a two-dimensional beam analysis was used to obtain ion positions and energies at the exit of the first grid. These positions and energies were then used as the set of input data for the 3D beam analysis. This technique allows us to use larger meshes, thereby reducing the number of meshes required for calculations. As a result, the 3D beam analysis applied to the MeV accelerator in JAEA with 15 beams showed good agreement with experimental measurements.
The analysis was applied to a 1/4-accelerator model having 320 beams for ITER, as shown in Fig.4-9. This is the first attempt in the world to perform such a large-scale 3D beam analysis. The right-hand side of Fig.4-9 shows the intensity distribution of the beam produced from the aperture group near the grid support structure. The beams from the peripheral aperture lines (insets (a) and (b)) were deflected outward owing to repulsion between the beams. To compensate for these deflections, a metal ridge was attached around the apertures at the backside of the extractor. This metal ridge distorted the electric field, steering the deflected beams inward. For the beam near the grid support structure (insets (c) and (d)), the grid support structure, instead of the metal ridge, was used to compensate for beam deflections. Thus, this analysis allowed us to identify and compensate for beam deflections in advance of experiments. The compensation method has been tested in the MeV accelerator and applied to the ITER design.
The present study was sponsored by the ITER organization as an ITER R&D task, No.C53TD48FJ.

