Even after a nuclear reactor is shut down, nuclides such as fission products (FPs) decay, and decay heat is generated. The accident at the TEPCO’s Fukushima Daiichi NPS (1F) was caused by a failure of the ultimate decay heat removal because of the loss of electric power due to the tsunami.
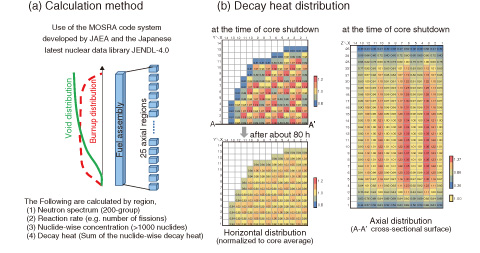
Understanding the core melt progression in accidents enables the location of melted fuel to be estimated and supports further improvements in the safety of nuclear reactors. The detailed analysis of the core melt progression begins with a prediction of the decay heat distribution in the core at the time of shutdown. Although there are some simple formulae for estimating the decay heat, they do not yield an accurate time-dependent decay heat distribution in the core. Thus, we newly developed data and a code to predict the time-dependent three-dimensional decay heat distribution. They were applied to the decay heat analysis of each core of 1F1, 1F2, and 1F3. In this method, each core is divided into four or five horizontal regions corresponding to different fuel assembly types or refueling batches, and each region is furthermore divided into 25 axial regions that have different burnup values and void fractions, as shown in Fig.1-38 (a). For each region, the nuclide-wise concentration is calculated for more than 1000 nuclides considering the operating conditions of each plant until core shutdown. Then, we can obtain the nuclide-wise decay heat in each region using the decay and heat generation constants. The region-wise decay heat is calculated by summing the nuclide-wise decay heat.
Fig.1-38 (b) shows the obtained decay heat distribution of 1F2, the core melting time of which is estimated to be about 80 h after core shutdown. The decay heat at the time of core shutdown is approximately proportional to the power density under normal operating conditions because the decay heat just after shutdown is dominated by the concentrations of short-lived FPs, which are in equilibrium according to the power density of each region. After that, the decay heat distribution gradually becomes flatter owing to the disappearance of the short-lived FPs. The obtained three-dimensional decay heat information is useful for future detailed analyses of the core melting progression because the decay heat is an important parameter for the movement of melted materials.

