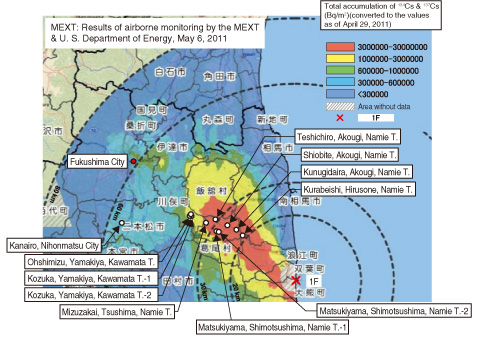
Fig.1-15 Locations investigated (although the distribution map was published on May 6, 2011, the values are those ones converted to as of April 29, 2011)
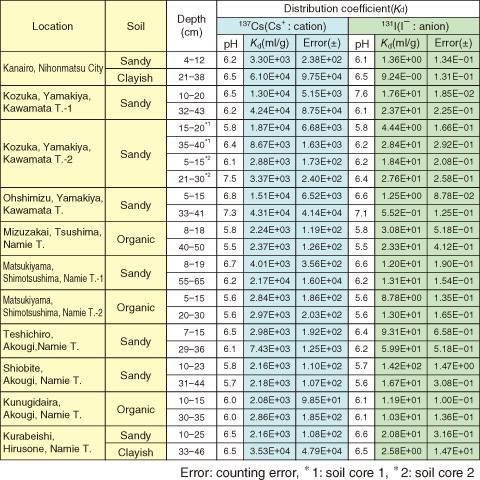
Table 1-1 Kd values of 137Cs and 131I onto each soil sample
The accident at the TEPCO’s Fukushima Daiichi NPS (1F), which was caused by the Great East Japan Earthquake in March 2011, led to the release of volatile radionuclides (RNs) that were deposited on the surrounding environment (e.g., soils, forests, residential land) around Fukushima Prefecture. The Ministry of Education, Culture, Sports and Technology (MEXT) initiated a project for making the distribution maps of dose rate, etc. in cooperation with Ministry of Agriculture, Forestry and Fisheries, JAEA, universities, etc. This work was conducted as part of the project described above.
The Geoslicer investigation examined the depth distribution of RNs in the soil as of about three months after the 1F accident. A total of 11 locations were selected in Nihonmatsu City, Kawamata Town, and Namie Town (Fig.1-15). Plate-shaped soil samples from a maximum depth of about 1 m (10 cm wide and 2 cm thick) were obtained, and soil samples for RN analysis were taken after the soil was observed and described. The γ decay nuclides were analyzed using a Ge semiconductor detector.
Both cesium-134 (134Cs) and cesium-137 (137Cs) were detected in all the locations investigated, and tellurium-129m (129mTe) and silver-110m (110mAg) were detected only in locations where the dose rates were high. For the depth distribution of radiocesium (RC), at many of the locations investigated, RC more than 99% of the inventory distributed within depths of 10 cm and 14 cm in soil in the surface layer (mainly sandy soil) and in soil at locations that are supposed to have been used as farmland (mainly organic and clayish soils), respectively. The apparent diffusivities (Da) derived from penetration profiles near the surface layer showed similar levels (10-11 m2/s) for all the RNs detected, although the Da values tended to be higher in the soil at locations that are supposed to have been used as farmland (Da = 0.1~1.5 × 10⁻¹⁰ m2/s) than in soil in the surface layer (Da = 0.65~4.4 × 10⁻¹¹ m2/s). Because the distribution coefficients (Kd) of cations (Cs+) and anions (I-) differed significantly (Table 1-1), the respective Da values were estimated to differ significantly. However, they were at similar levels for all the RNs; therefore, the Da values were believed to be controlled by dispersion caused by rain water flow.
Thus, we can say that transport of RC in the soil is always quite slow because the Kd values onto soil are quite large. The transport of RNs in soil is strictly related to Kd, which depends on the minerals constituting the soil, their contents, the content of organic matter, and other factors. In particular, the clay mineral component affects the reversibility and irreversibility of sorption. For the long-term prediction of RC transport, it is essential to understand those details, and this remains as future work.
The present study was sponsored by the Ministry of Education, Culture, Sports, Science and Technology of Japan (MEXT).

