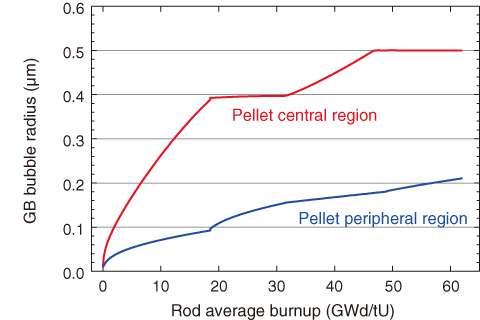
Fig.6-3 Fission gas bubble growth in central and peripheral regions of fuel pellet
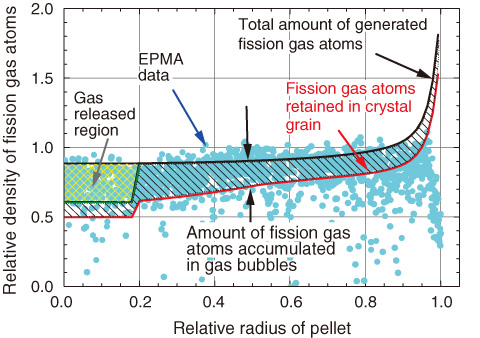
Fig.6-4 Distributions of densities of fission gas in the radial direction of fuel pellet
In high burnup light water reactor fuel pellets, a large number of fission gas atoms is retained through an extended period of irradiation. The gas is accumulated in gas bubbles in the fuel crystal structure and could swell the pellet, or gas released from the bubbles could increase the internal pressure of the fuel rod and expand the cladding outward, which has undesirable effects on the integrity of the fuel rod. Accordingly, to accurately evaluate the growth of gas bubbles in pellets, a new model was developed that allows better prediction of gas bubble growth. The model was installed in the fuel performance code FEMAXI-7.
The gas bubble grows as the excess bubble internal pressure exceeds the external resistance from the surrounding structure. However, because an earlier model assumes that the bubble gas pressure is always in balance with the external resistance, reliable evaluation has been difficult. In this study, the bubble growth was modeled by a process in which the gas bubble pressure is enhanced and extends the bubble outward into the surrounding crystallite structure.
Next, a calculation was performed to predict the bubble growth and accumulated amount of fission gas. When the radius reaches 0.5 μm, gas release occurs, and growth ceases. Fig.6-3 shows the bubble growth (bubble radius) with burnup.Regarding the final accumulation of gas atoms after this irradiation process, Fig.6-4 compares the calculated and measured profiles of the fission gas atoms density. The latter were obtained by an electron probe microanalyzer (EPMA). The red curve and blue dots indicate the density of gas atoms retained in the crystallites of the fuel pellet. The red curve represents the distribution trend of the blue dots fairly well. The hatched area between the red and black curves corresponds to the accumulated amount of gas, which is calculated to be about 18% of the total generated.
In an experiment on a simulated reactivity-initiated accident conducted in the Nuclear Safety Research Reactor using this fuel, the fission gas release rate was estimated to be about 22% of the total generated, which proves the satisfactory predictability of the model. The result of another experiment indicated that the gas is released mainly from grain boundary gas bubbles. The proximity of the calculated and measured values supports this result.
Thus, this new model has enabled us to more accurately predict fission gas bubble growth behavior as one of the factors related to the integrity of fuel rod.

