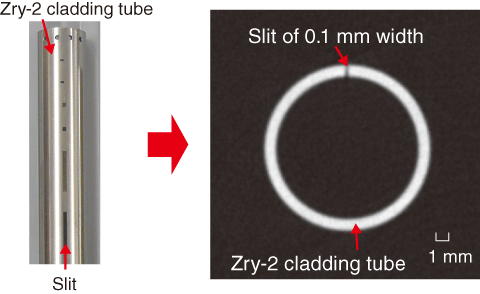
Fig.1-22 X-ray CT image of a zircalloy-2 cladding tube with a slit
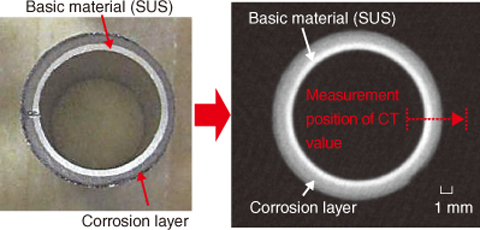
Fig.1-23 X-ray CT image of a SUS tube with a corrosion layer
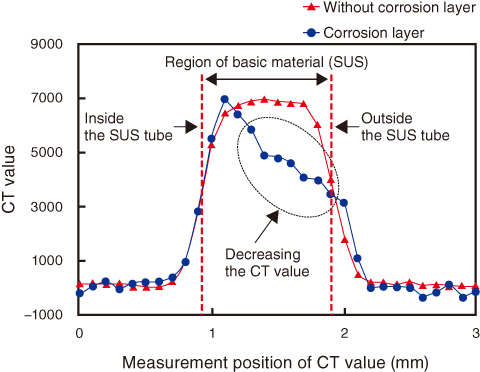
Fig.1-24 CT value distribution of a SUS tube
The fuel assemblies of the TEPCO’s Fukushima Daiichi NPS (1F) will be transported from the spent fuel pool to the shared pool and stored for a long time. In the severe accident of 1F, concrete fragments fell into the spent fuel pool due to the hydrogen explosion, and sea water was temporarily injected to cool the fuel assembly. There is a possibility of defects (the corrosion and the crack) forming on the fuel assembly component materials (cladding tube, tie plate, spacer, support grid, etc.) due to the effects of the concrete fragments and sea water. Thus, it is necessary to evaluate the integrity of the fuel assemblies to safely transport from the spent fuel pool and store in the shared pool.
In this study, we developed a technique for detecting cracks and the corrosion damage on the fuel cladding tube using an X-ray computed tomography (CT) technique, which is the non-destructive way to examine the irradiated fuel assembly.
Zircalloy-2 (Zry-2) cladding tube specimens were manufactured with slits designed to simulate cracks, and an X-ray CT examination was performed on them to obtain data about crack-detection performance with this apparatus. In addition, SUS tube specimens having corrosion layers were manufactured and also subjected to X-ray CT examination to obtain basic data about detection performance on the corrosion layer. The 0.1-mm-wide slit on the Zry-2 cladding tube could be observed on the X-ray CT image in Fig.1-22, and a corrosion layer (gray region) with a thickness of more than 0.35 mm could be discriminated from the basic material (white region) in the X-ray CT image in Fig.1-23. An X-ray CT examination of the Zry-2 cladding tube based on this result has been conducted.
The X-ray CT image is composed of CT values, which depended upon the density. This image analysis technique was developed to evaluate the slit width and the corrosion thickness using the CT value distribution (Fig.1-24). The defect on the fuel cladding tube can be evaluated without dismantling of the fuel assembly by using this image analysis technique. At present, a high performance image analysis technique is being developed to increase the evaluation accuracy.

