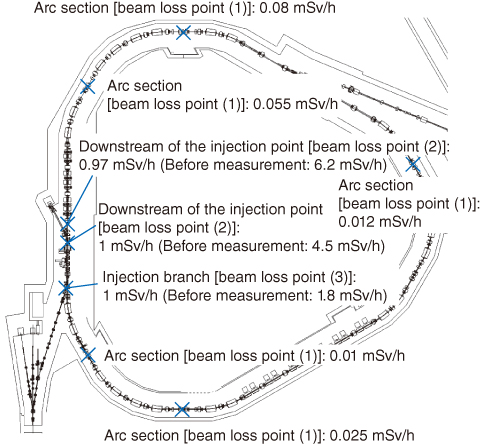
Fig.5-39 Residual dose distribution of J-PARC 3 GeV synchrotron
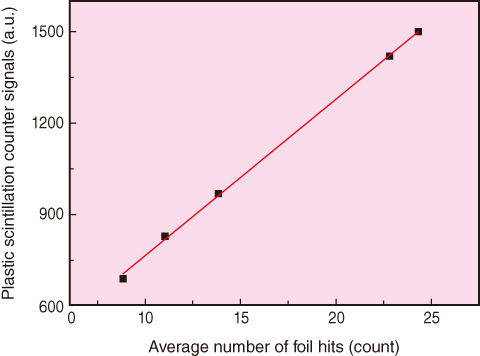
Fig.5-40 Beam loss as a function of average number of foil hits
The 3 GeV rapid cycling synchrotron (RCS) at J-PARC has been operational since 2007. The RCS ring generates a high-power proton beam (1 MW) at a repetition rate of 25 Hz, which is supplied to the main ring and the neutron production target. In the RCS, negative hydrogen ions are accelerated to 400 MeV by a linac and passed through a thin carbon foil, which converts them into protons by removing the two electrons. The protons are then injected into the synchrotron and accelerated to 3 GeV in 20 ms.
In a high-intensity accelerator such as J-PARC, minimizing the beam loss is vital to retaining the activation of the accelerator components within an allowable level. Based on experience with the RCS and other accelerators, provided that the dose rate immediately after beam stop is below 1 mSv/h at the accelerator component surfaces, the exposure dose during maintenance work can be suppressed to less than several hundred μSv. Therefore, to ensure that the dose rate remains below 1 mSv/h, we must understand the distribution of the dose rate generated by the beam loss. To this end, we measured the dose rate on the equipment surfaces during each maintenance period, and elucidated the dose rate conditions produced by the various operation modes. Additionally, we considered the cause of the activation and appropriate countermeasures.
Fig.5-39 shows the measured dose rate around the RCS. Most of the radioactivity generated by the accelerator components is concentrated at the injection section (the area of the straight line on the left side of Fig.5-40). Away from the injection section, the dose rate remains below 0.1 mSv/h [beam loss point (1)]. In the injection section, peaks of local activation appear downstream of the injection point [beam loss point (2)] and at the branch between the injection and the circulating beam [see beam loss point (3), Fig.5-39]. The results indicate that the activation at point 2 is sourced from interaction between the beam and the thin carbon film (see beam-study results in Fig.5-40), while the beam loss at point 3 is caused by increased pressure of the injection beam transport line. After decreasing the beam loss by inserting another source, we increased the beam power while retaining the dose rate below 1 mSv/h at both loss points.
In summary, we increased the beam power by reducing the beam loss.

