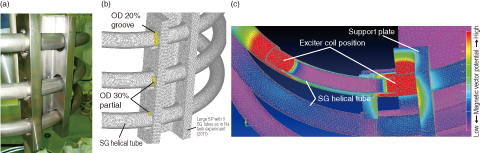
Fig.7-8 (a) View of the mock-up test model; (b) FEM model; (c) Magnetic vector eddy current field distribution
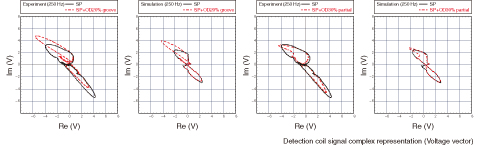
Fig.7-9 Comparison between ECT measurements and FEM simulations of SP and defects
The eddy current technique (ECT) is a well-established method for detecting defects in metallic structures, which is easier and more repeatable than alternatives; it works by monitoring changes in a coil’s impedance. When applying ECT to the assessment of the soundness of the SG tubes of “Monju” FBR, the complexity of the large metallic support plate (SP) structure surrounding the long SG helical tubes adds additional electromagnetic interference or noise in the primary electromagnetic field created by the ECT coils. To improve the inspection technology for FBR SG tubes, precise evaluation of these effects requires reliable and verified numerical electromagnetic tools operating in conditions as close as possible to those in “Monju.”
A three dimensional (3D) electromagnetic code, using finite element method (FEM), researched and developed in-house at JAEA, analyzed the electromagnetic field of an ECT system composed of excitation-detection coils. The code was validated by comparing numerical simulations with experimental measurements using three SG helical tubes with a large SP mock-up (Fig.7-8(a)). Large scale numerical simulations of FEM models with up to 5 million second-order tetrahedrons (Fig.7-8(b)) were run on JAEA supercomputers with 1024 parallel CPU cores, distributed in a mixed Open MP-MPI environment (Fig.7-8(c)). Variation in the defect signals due to helical structures and defect proximity to the SP was compared against measurements for outer tube defect (OD) grooves spanned full circumferential with depth 20%tw (from tube wall thickness), and around defects that spanned only a quarter part of the circumference and had a depth of 30%tw. A full comparison with the experimental results for defect and SP signals validated the FEM computation of ECT signals for SG helical tubes (Fig.7-9).
Large scale numerical simulations using reliably tested and verified FEM codes are aimed at providing improved understanding of the ECT signal/noise ratio, where electromagnetic interference appears due to the close proximity of multiple tubes or intricate 3D structure geometries to facilitate further development of inspection technology for “Monju” SG tubes.

