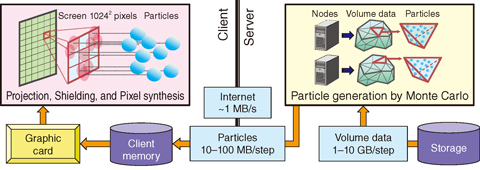
Fig.10-5 Abstract of the remote visualization system
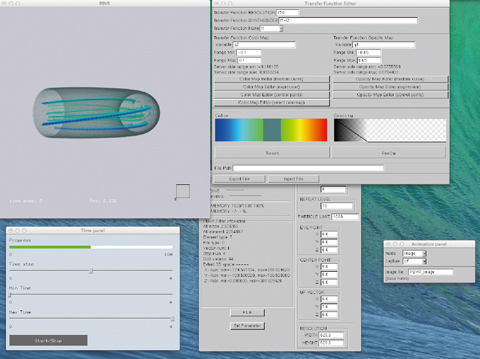
Fig.10-6 Example of the use of the remote visualization system
The recent progress of supercomputer technology has resulted in an increase of the simulation scale and the resulting data size. It is difficult to visualize such large-scale data by the conventional offline processing approach because all the resulting data needs to be transferred to a PC on which commodity visualization software has been installed. To resolve this problem, we have developed a remote visualization system based on a visualization method called “particle-based volume rendering”.
This system converts volume data (resulting data) into particle data (Fig.10-5). The conventional visualization technique involves the growth of polygons commensurate with the volume data size. In contrast, our system remarkably compresses the gigabyte-order large-scale volume data into small particle data, whose size is determined by the screen resolution and is typically of the order of 10 megabytes. By focusing on this feature, the particle conversion and rendering processes are separated into a server and a client, respectively, bringing about a distributed visualization model with the least-size data transfer.
The other issue facing the large-scale data visualization is parallel processing. The conventional parallel visualization process subdivides the volume data into numerous sets of sub-volume data. However this requires parallel polygon-sorting against the screen, which increases node communication costs and decreases parallel performance. Our system generates the particle data in parallel and is thus able to combine the entire particle data without such a sorting process. However, it is difficult to maintain a load-balance of the parallel particle generation because of the deviation of the particle distribution. Dynamic load-balance has solved this problem, which is developed to assign a subsequent particle generation to empty cores. This technique has accelerated the particle generation with high parallel efficiency up to 1000 cores.
A comparison of the performance of our system with that of conventional visualization software is conducted by connecting a remote supercomputer and PC via a network. Our system achieved ∼30 times faster speed than that of the conventional software and enabled users to interactively visualize the large-scale data located on a remote supercomputer. To disseminate our system to many users within JAEA and beyond, a graphical user interface has been prepared (Fig.10-6) and released as open-source software.
(https://ccse.jaea.go.jp/software/index_eng.html)

