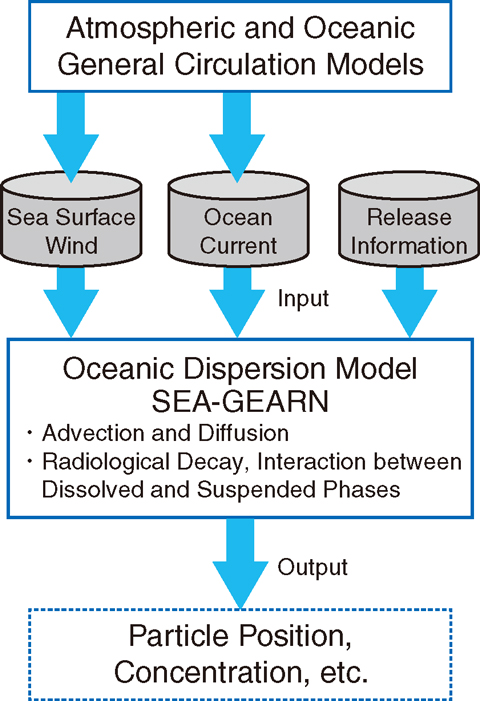
Fig.4-24 Schematic of SEA-GEARN
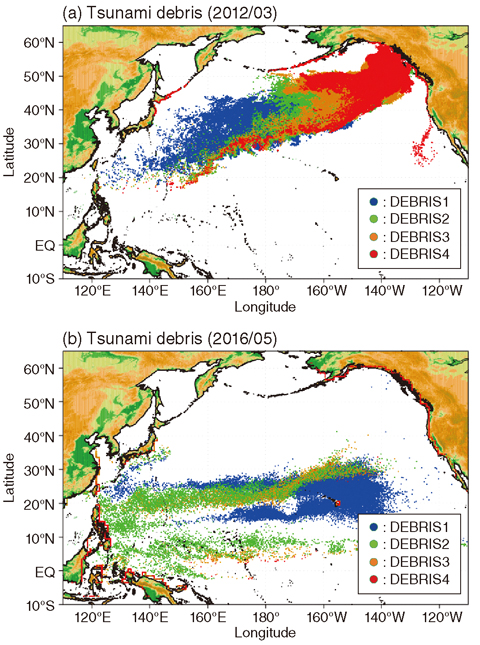
Fig.4-25 Distribution of tsunami debris in (a) March 2012 and (b) May 2016
We are developing an oceanic dispersion model called SEA-GEARN (Fig.4-24) to assess the effects of pollutants such as radionuclides on the marine environment. We implemented drift simulations of tsunami debris such as lumber and plastic products flushed out due to the tsunami accompanying the Great East Japan Earthquake using SEA-GEARN in cooperation with domestic institutes. Tsunami debris will drift in the Pacific Ocean for a long time, probably damaging marine ecosystems or the coastal environment. Therefore, understanding the distribution of tsunami debris is important to assess its effect on the marine environment and prevent marine pollution in advance.
The Japan Aerospace Exploration Agency analyzed satellite images obtained by an advanced land-observing satellite called Daichi, which enabled us to determine the initial release points and duration for the drift simulation. We implemented the hindcast simulation from March 2011 to September 2013 using sea surface wind and ocean current data calculated by an ocean data assimilation system, which synthesizes a model and observations, developed at the Meteorological Research Institute of the Japan Meteorological Agency. This was done to assess the past distribution of tsunami debris. The forecast simulation was further implemented from October 2013 to June 2016 with sea surface wind and ocean current data forecasted by the Japan Agency for Marine-Earth Science and Technology. Actual tsunami debris comprised various items such as lumber and plastic products. A part of the tsunami debris above the sea surface was directly driven by wind on the sea surface. Therefore, tsunami debris were divided into four types according to the ratio of the volume above the sea surface to that below in the drift simulation.
It was suggested that tsunami debris flushed out from the Tohoku district was mainly transported southeastward after the earthquake and then transported eastward by the Kuroshio Extension in the North Pacific (Fig.4-25(a)). The distribution of tsunami debris in the hindcast simulation well agreed with the shipboard sighting information compiled by the Japanese government. The hindcast simulation also demonstrated tsunami debris reported by the news such as a fishing boat seen off the Canadian coast in March 2012. According to the forecast simulation, it was suggested that tsunami debris off the west coast of the United States would be mainly transported southwestward and distributed in the southern North Pacific (Fig.4-25(b)). It was remarkable that tsunami debris would be concentrated around the Hawaiian Islands. In the future, we plan to refine the future distribution of tsunami debris by ensemble drift simulations with several different types of sea surface wind and ocean current data.
The present study was sponsored by the Ministry of the Environment.

