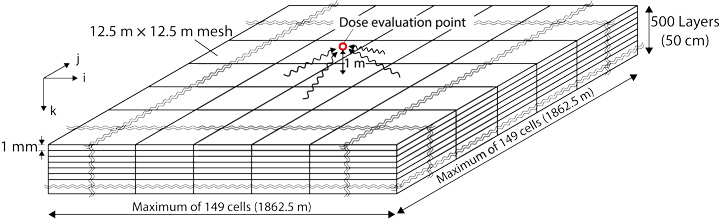
Fig.1-25 Schematic of a tool for evaluating air-dose rates
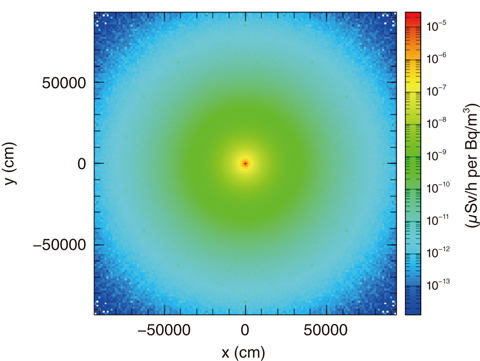
Fig.1-26 Plot of radiocesium activity to dose-rate-conversion factors
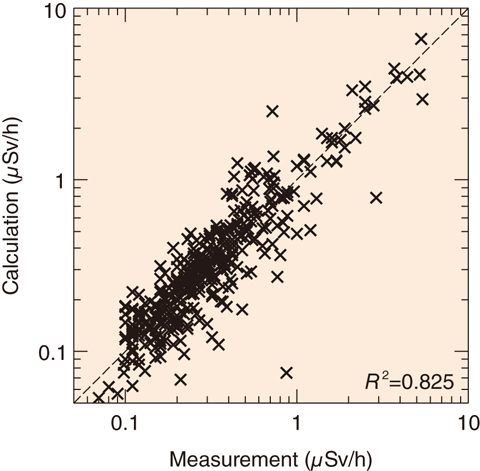
Fig.1-27 Correlation of calculated and measured dose rates
Massive amounts of radioactive cesium (134Cs and 137Cs) were released during the accident at the TEPCO’s Fukushima Daiichi NPS in 2011. 137Cs will remain in the environment for a long time owing to its 30-year half-life. These isotopes migrate horizontally and vertically owing to disturbances by decontamination, typhoons, penetration of rain into the ground, and so on. Understanding the relationship between the distribution of radioactive cesium and the air-dose rate in realistic situations is not easy. Therefore, we developed a tool to evaluate complex three-dimensional distributions of radioactive cesium and calculate dose rates (Fig.1-25).
Using this tool, we divide the ground up into 10 million blocks of soil. The 134Cs- and 137Cs-radioactivity amounts are given by measurements, simulations of surface-soil transport, and the like and are set individually for each block. This precise setting of the radioactive-cesium distribution enables accurate evaluation. Conversion factors for calculating the air-dose rate were evaluated by PHITS, the Monte Carlo transport-simulation code developed by JAEA. Using a supercomputer, an accurate calculation was attained over a short calculation time. An example of the conversion factors is shown in Fig.1-26, which converts from 137Cs 1 Bq/m3 on the blocks’ surfaces to the air-dose rate at 1 m above the surface.
We tested the tool using the soil-activity and dose-rate measurements at about 80 different locations in Fukushima Prefecture, including rice paddies, fields, and parks. It was verified that the tool gave realistic predictions for the actual dose rates (Fig.1-27).
The tool is applicable for numerous purposes, e.g., choosing the best remediation method and evaluating the change in air-dose rates before and after typhoons that move the surface soil. It is also being used to understand how dose rates in the Prefecture are influenced over time by radioactive decay and seepage deeper into soil.

