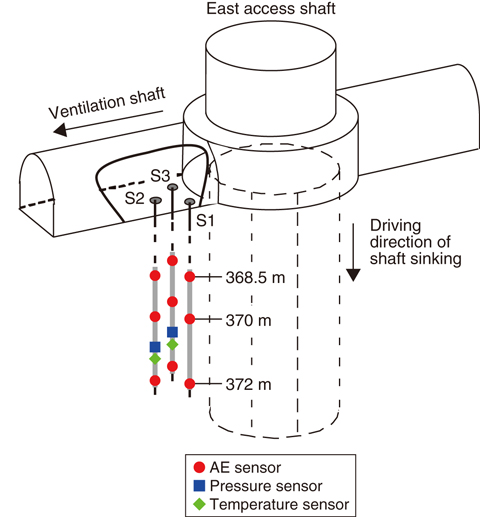
Fig.8-17 Layout of the sensors
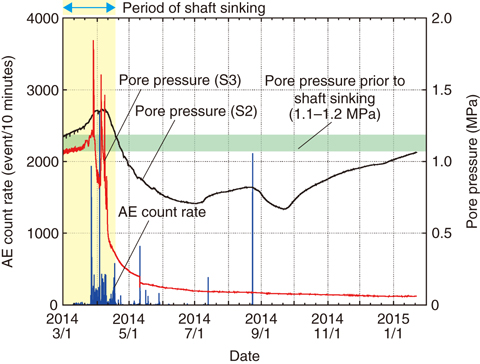
Fig.8-18 AE count rate and pore pressure with elapsed time
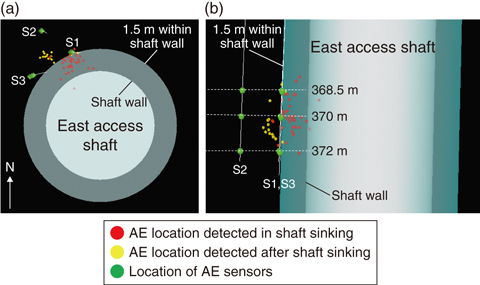
Fig.8-19 Three-dimensional distribution of AE sources
In the geological disposal of high-level radioactive waste, shafts, and spiral tunnels will be constructed as access galleries. During excavation, fractures will be induced around the wall of the gallery, owing to stress redistribution and the impact of excavation. This damage can act as a migration pathway for radionuclides to the surface. Therefore, we should investigate the characteristics of the damage around a shaft wall. However, this subject has yet to be studied in detail.
In the Horonobe URL, we developed optical sensors capable of detecting acoustic emission (AE), pore pressure, and temperature; we then inserted them into the boreholes excavated around the east access shaft (Fig.8-17).
Fig.8-18 indicates the AE count rate over 10 min and the pore pressure as functions of elapsed time. In the period of shaft sinking, AE events are drastically increased. The pore pressure in the borehole S3, which was drilled 1.5 m from the shaft wall, both increased and decreased drastically during the shaft sinking. After the sinking, a small AE count rate was observed. The pore pressure of borehole S3 decreased to almost 0 MPa; in contrast, the pore pressure of borehole S2, which was drilled 4.0 m from the shaft wall, decreased to 0.7 MPa, before increasing to its pre-excavation value (1.1 to 1.2 MPa), as indicated in the green hatched zone in Fig.8-18. Fig.8-19 shows the three-dimensional distribution of the AE sources. AE sources are concentrated within 1.5 m of the shaft wall during the period of shaft sinking, and then the distribution spreads out.
In the future, we will construct a long-term conceptual model of the excavation-damaged zone on the basis of long-term monitoring of AE and pore pressure.

