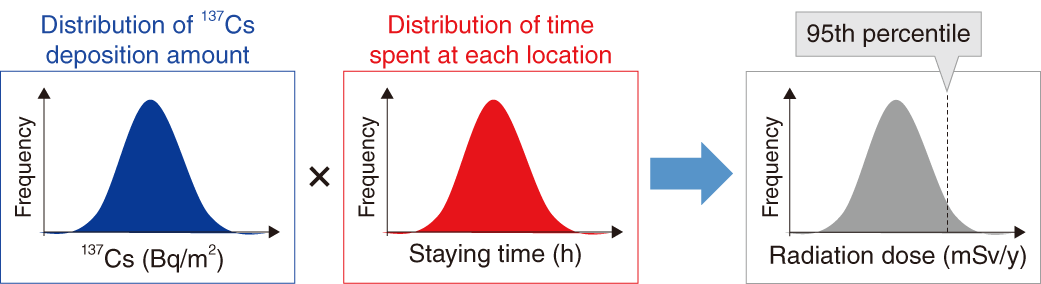
Fig.1-26 Dose assessment using a probabilistic approach
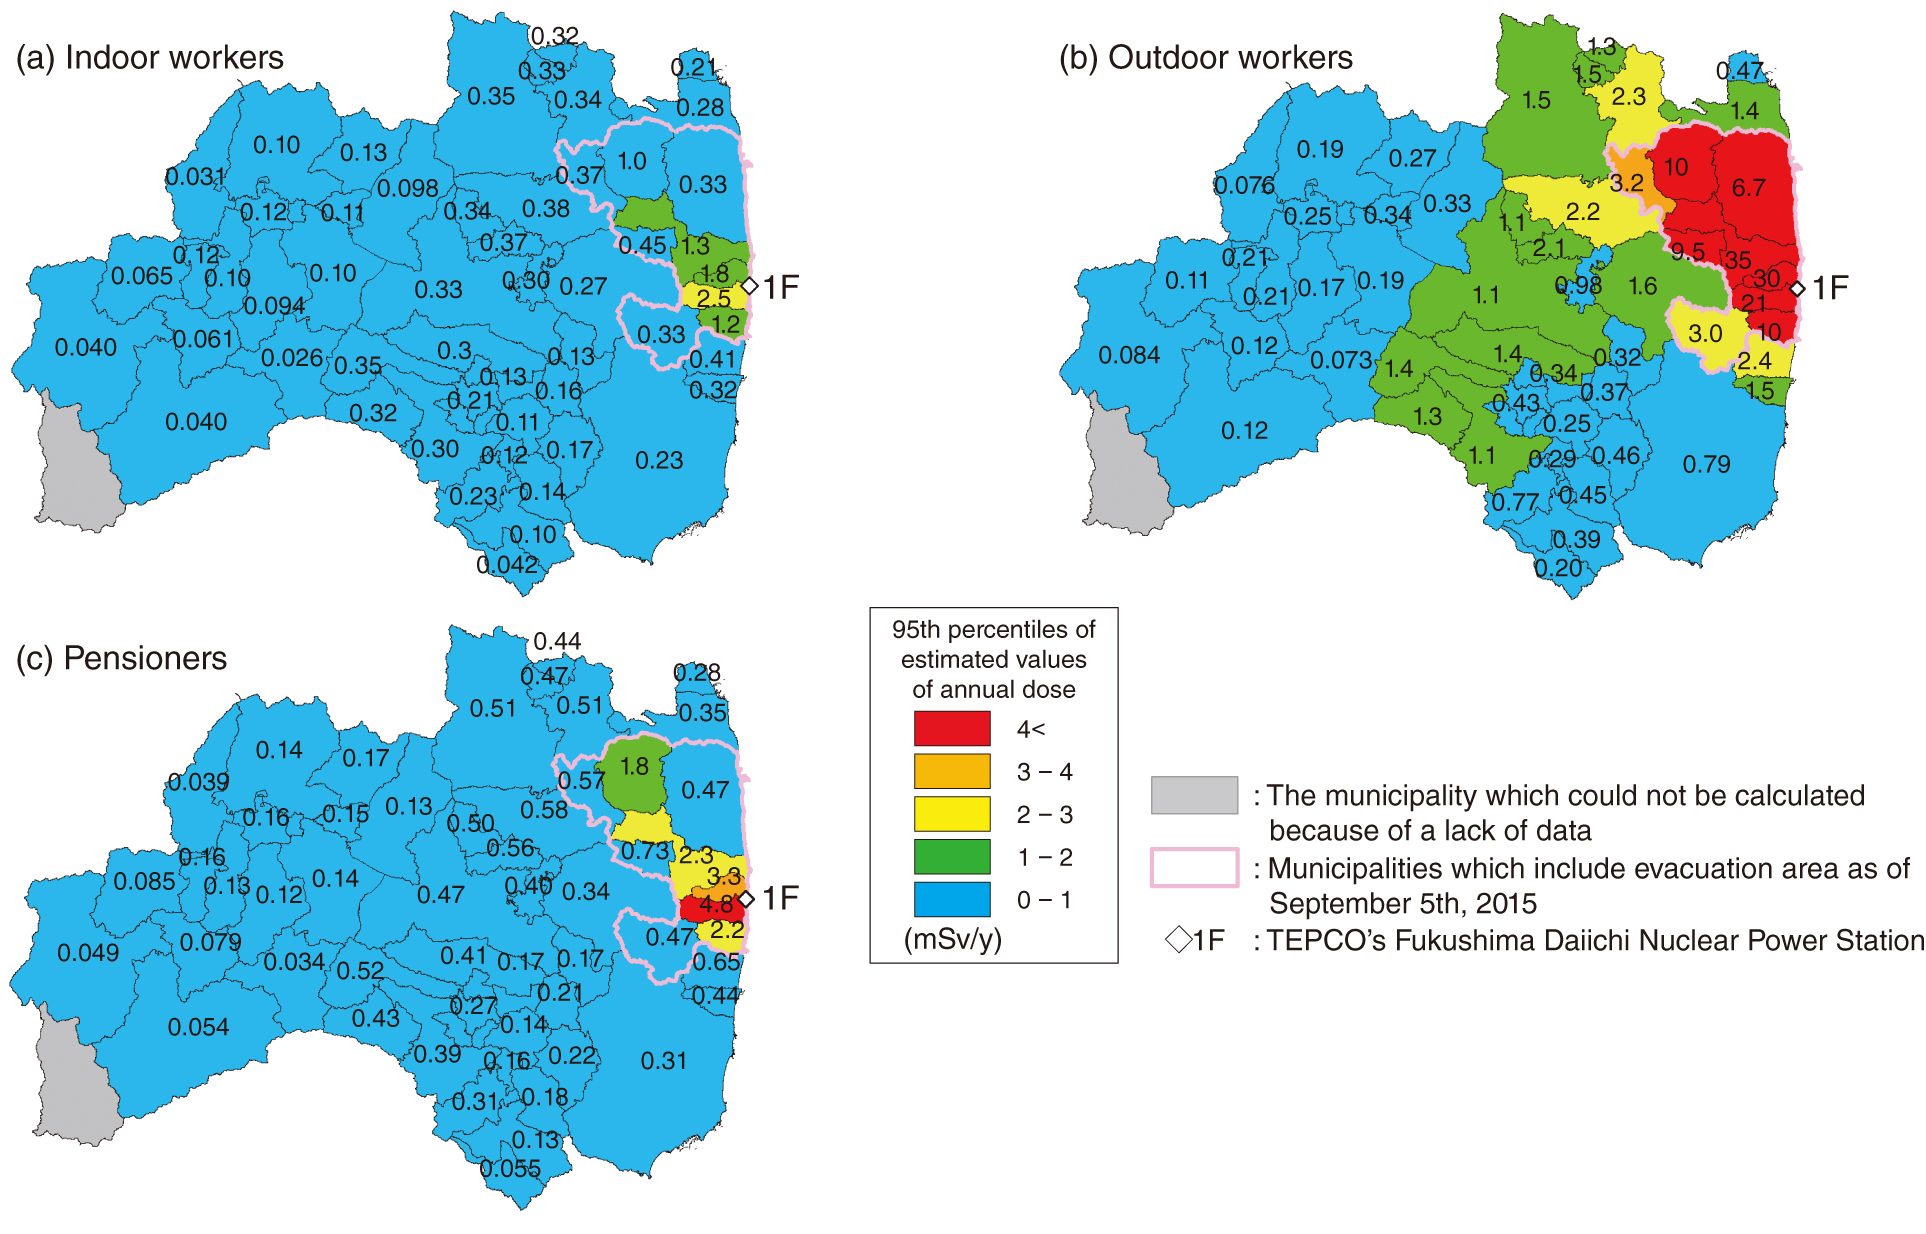
Fig.1-27 95th percentiles of the estimated values of annual doses from March 2016
Large quantities of radioactive materials were released by the accident at the TEPCO’s Fukushima Daiichi NPS (1F), and the influence of the accident still continues in affected areas. In terms of radiation protection, the Japanese government has adopted annual additional doses of 1 mSv as a long-term dosimetric target. According to the Ministry of the Environment, an additional dose of 1 mSv/y corresponds to an air-dose rate of 0.23 μSv/h. We calculated annual doses to residents under the assumption that the air dose outside of their house is 0.23 μSv/h to assess the effectiveness of decontamination based on this value.
Radiation doses can be calculated from the degree of contamination at a living location and the time spent at these locations. The surface-deposition amounts of cesium 137 (137Cs) in each municipality (as measured by airborne-monitoring survey) and actual survey data for time spent in houses, workplaces, and the other locations were used in this calculation. The probability distributions of deposition amounts of 137Cs and staying times were generated based on these actual data. Numerical values were chosen from those distributions at random as input values for our probabilistic dose-assessment model (Fig.1-26). Residents were divided into three groups, i.e., indoor workers, outdoor workers, and pensioners, by differences in their behavioral patterns. Calculations were conducted for all municipalities in Fukushima Prefecture. The radiation-dose distributions of each population group in each municipality were derived by 10000 repetitions of the calculation, and the 95th percentiles of these distributions (Figs.1-27(a), (b), and (c)) were compared with 1 mSv/y.
The radiation doses of indoor workers were found to be lowest, and those of outdoor workers were highest. The doses to the 95th percentile of indoor workers and pensioners were less than 1 mSv/y in all municipalities except for 5 in the former evacuation area. On the contrary, the doses to the 95th percentile of outdoor workers were more than 1 mSv/y in one-third of municipalities. These results indicate that (1) radiation doses to all population group in two-thirds of municipalities were adequately reduced by decontamination of residential districts; (2) dose management is needed for outdoor workers in one-third of municipalities; and (3) dose management for all population groups and decontamination in other areas besides residential districts is also necessary in 5 municipalities in the former evacuation area.
We estimated doses to working people and pensioners in this study, and we are going to develop a model for assessment of doses to children returning to the evacuation areas in the future.

