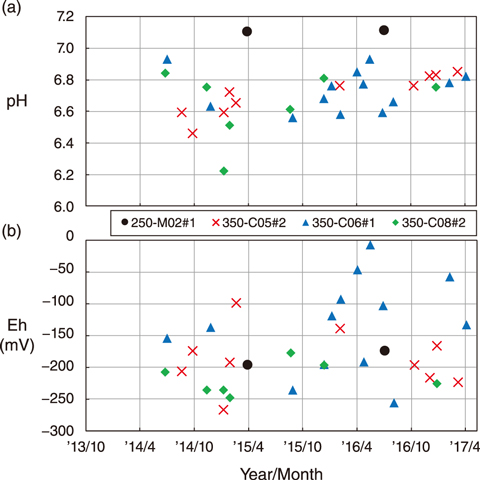
Fig.8-14 Temporal variation in pH and Eh of groundwater observed in boreholes near the URL
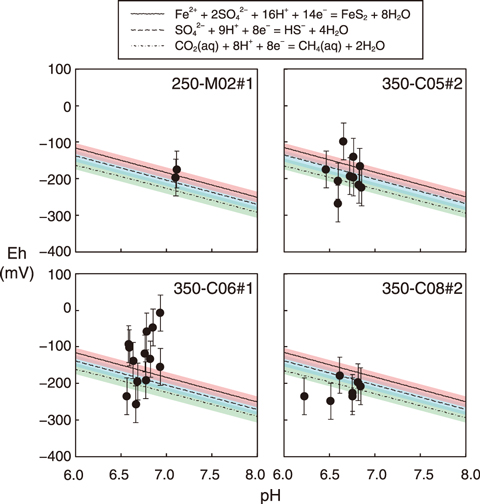
Fig.8-15 pH−Eh diagram of groundwater near the Horonobe URL
Understanding the redox condition of groundwater is important for geological disposal of high-level radioactive wastes, as it can affect the solubility of redox-sensitive radioactive nuclides and the corrosion rate of overpack. Generally, not all of the redox-sensitive species in groundwater are in equilibrium with respect to the measured redox potential (Eh). The fluctuation range or uncertainty of the Eh can be estimated by calculating the equilibrium potential and the fluctuation range of the dominant redox reactions and by comparing them with measured Eh values.
Thus, this study aimed to evaluate the uncertainty of Eh using hydrochemical monitoring data of groundwater in the Horonobe Underground Research Laboratory (URL). The measured temporal variation of the pH and Eh of the groundwater is shown in Figs.8-14(a) and (b), respectively. In zone 1 of borehole 250-M02 (250-M02#1) located at 250 m gallery, the measured pH and Eh were 7.1 and approximately −200-−170 mV, respectively. The three boreholes located at 350 m gallery (350-C05#2, 350-C06#1, 350-C08#2), the pH and Eh ranged from 6.2 to 7.0 and from −250 to 0 mV, respectively. Significant changes in the concentration of chemical species were not found after the excavation of the boreholes or niches adjacent.
A pH−Eh diagram of the estimated redox reactions is shown in Fig.8-15, where the black dots and three lines represent the measured values and equilibrium potential of the reactions, respectively. The colored area represents the possible fluctuation range of the potential of each reaction as calculated by the variation in the concentration of chemical components and groundwater temperature. The error bars in the Fig.8-15 indicate that the difference between the measured values and equilibrium potentials was approximately ±50 mV. This is reasonable when considering the uncertainty of the measured value of Eh based on previous studies. This uncertainty is likely caused by the measurement error of the sensor, deterioration of the electrode, and sticking of bubbles degassed from the groundwater on the electrode. The data for 350-C06 was probably not in equilibrium with respect to the redox reactions because the Eh fluctuation was larger than observed in other boreholes (Fig.8-14(b)).
Future work will aim to continue hydrochemical monitoring work towards the development of methods to reduce the measurement error.

