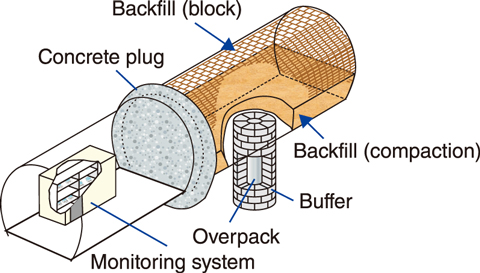
Fig.8-12 Illustration of the in situ engineered barrier system
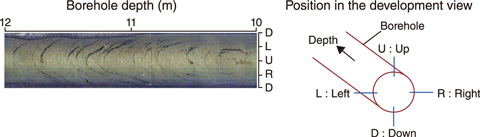
Fig.8-13 Development view of borehole wall image
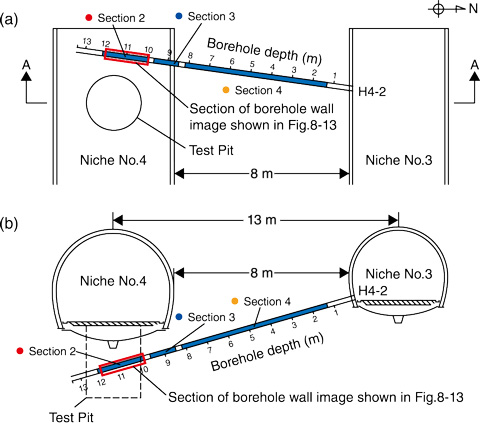
Fig.8-14 Layout of the hydraulic test: (a) plan view and (b) cross section
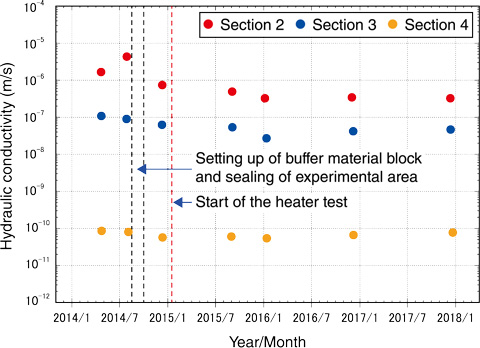
Fig.8-15 Simulated hydraulic conductivity
The construction of underground facilities induces fractures in the rock mass around the underground repository. This has particular implications for high-level radioactive waste (HLW) disposal projects, where fracture development creates an excavation-damaged zone (EDZ) that increases the hydraulic conductivity of the surrounding rock mass and can provide a pathway for migrating radionuclides from the disposal facilities. It is therefore necessary to develop a model that can estimate the future hydraulic conductivity of an EDZ and perform a comprehensive HLW-disposal safety assessment. In the Horonobe Underground Research Laboratory, an in situ engineered barrier experiment was designed to simulate a realistic disposal environment. In this experiment, which occurred from October 2014 to December 2014, the steel overpack and buffer material were placed and the gallery was partially backfilled (see Fig.8-12). Groundwater injections then began in January 2015. Additionally, hydraulic tests were performed for the following four years around the test pit to investigate the change in hydraulic conductivity.
A camera was installed in one of the drilled boreholes (H4-2; see Fig.8-13); camera imaging indicated fractures around the test pit. Therefore, the hydraulic conductivity of the EDZ around the test pit included Sections 2 and 3; Section 4 was maintained as an unfractured section, as indicated in Figs.8-13 and 8-14.
The EDZ hydraulic conductivity in Sections 2 and 3 after the excavation of the test pit was 1.7−4.3 × 10⁻⁶ and 8.9 × 10⁻⁸ to 1.1 × 10⁻⁷ m/s, respectively, representing values 3−5 orders of magnitude higher than those in the unfractured zone (8.0−8.6 × 10⁻¹¹ m/s), as shown in Fig.8-15. In Sections 2 and 3, the hydraulic conductivity decreased by approximately one order of magnitude with time for the first two years, but then remained constant from January 2016. This suggests that the aperture of the EDZ fracture was not changed significantly, although the swelling of the buffer material did cause compression stress around the test pit. Therefore, these results provide fundamental data that will be instrumental in developing a model to predict the hydraulic conductivity of the EDZ.
(Nobukatsu Miyara)

