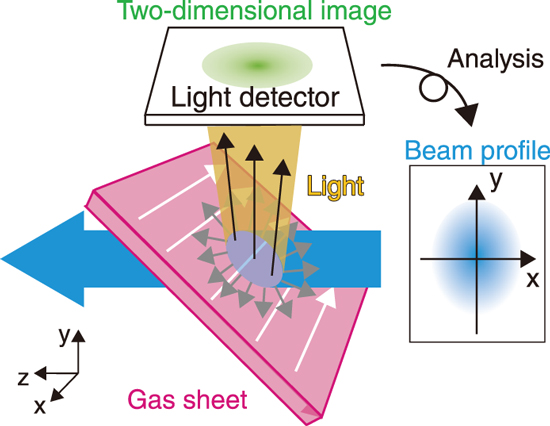
Fig.5-2 Concept of a new profile monitor using a gas sheet
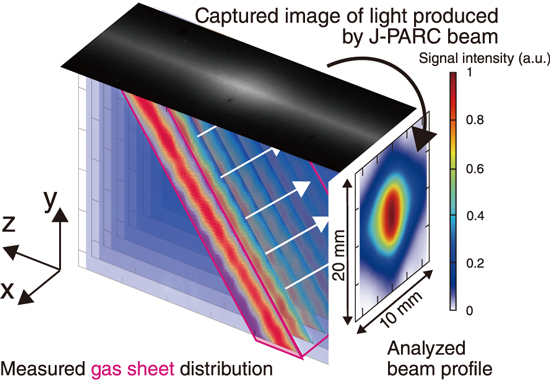
Fig.5-3 Schematic diagram of beam profile measurement with the developed monitor
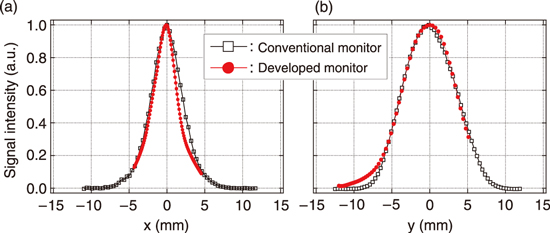
Fig.5-4 Comparison of profiles measured with a conventional monitor and the new monitor along the (a) x axis and (b) y axis
In a high-intensity ion accelerator such as that at J-PARC, the amount of radiation dose must be minimized because exposure of the accelerator components to a high radiation dose makes their maintenance difficult. A beam particle outside the design orbit may strike the beam pipe and radioactivate the pipe. To minimize the amount of radiation dose, suitable control of the beam based on constant monitoring of the beam orbit and beam profile is indispensable. In J-PARC, the beam profile is ordinarily measured by using a metal wire inserted into the beam orbit. The interaction of the beam and wire may induce the beam to be out of the design orbit and may radioactivate and/or break the wire itself. Therefore, the conventional beam profile monitor imposes a limit on increasing the beam intensity.
To measure a higher intensity beam profile, we developed an indestructible and noninvasive monitor with gas instead of a wire, as shown in Fig.5-2. When a beam particle passes through the vicinity of a gas particle, light is emitted from the gas particle because of beam–gas interaction. Since the spatial distribution of the light intensity is proportional to the beam profile, the beam profile can be obtained from an image of the light. We devised a method of injecting a gas formed into a sheet shape to measure the cross-sectional beam profile with high signal intensities. A beam profile measurement result obtained with the developed monitor is shown in Fig.5-3. The produced light signal was detected as white plots, and the image shows that the beam passed through the sheet-shaped gas. Since the signal distribution of the image does not directly correspond to the beam profile, we also developed a profile analysis method. As shown in Fig.5-4, the profile analyzed by this method agreed with the profile measured with the wire-type monitor ordinary used at J-PARC.
The developed monitor with gas as well as the conventional monitor with the wire were expected to adversely influence the beam because the beam–gas interaction can scatter the beam. However, the beam quality improved upon injecting a small amount of gas because the plasma produced by beam–gas interaction in addition to the lights canceled the electric repulsive forces among the beam particles which induce a decrease in beam quality. In future, we will investigate the mechanism of the beam–gas interaction and realize more intense and stable beam operation of J-PARC.
(Ippei Yamada)
<Previous: 5 Neutron and Synchrotron Radiation Research | Next: 5-2>

