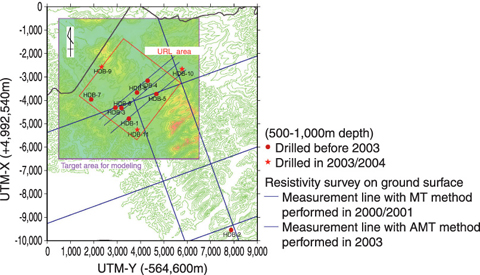
Fig.2-18 Location and time of resistivity surveys
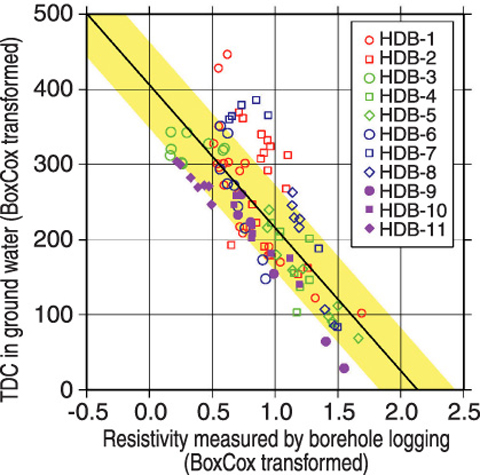
Fig.2-19 Relationship between measured resistivity and TDC in ground water
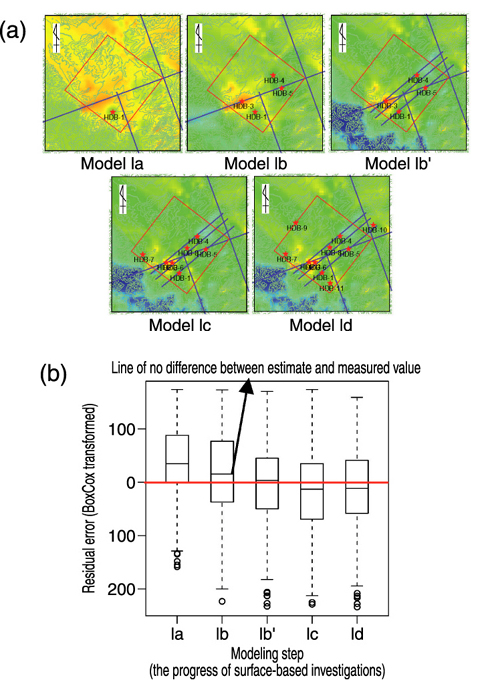
Fig.2-20 Change of the confidence level on 3-D model for TDC in ground water in each investigation steps
As a part of the Horonobe Underground Research Laboratory (URL) project, JAEA carried out surface-based investigations of soft sedimentary formations in a 3km × 3km area (the URL location) in Japan. The R&D work for URL construction is going on. This report gives an outline for a study aimed at understanding the geological environment and its change due to URL construction from ground surface measurements.
Different kinds of geological surveys: helicopter, seismic reflection, and resistivity of the ground surface, were carried out in the surface-based investigation phase. Especially, the resistivity surveys with different scales and resolutions were carried out step by step, such as from a helicopter with very large scale and low resolution, the survey on ground surface with medium scale and medium resolution and borehole loggings in deep boreholes with small scale and high resolution (Fig.2-18). In URL area, there was good correlation between resistivity and total dissolved composition (TDC) in groundwater as seen in Fig.2-19.
In this study, we constructed a 3-D resisitivity model in URL area by integration of the results of the different kinds of resistivity surveys based on a geostatistical method (Step wise kriging). Moreover, the different data sets made as the project progressed and the 3-D model developed from each data set were qualitatively evaluated for confidence and uncertainty by referring to the latest borehole investigation etc. The advantage of this methodology is that the confidence and uncertainty of a model can be evaluated in statistical sense.
Fig.2-20 shows the distribution of TDC in ground water calculated from the 3-D resistivity models (Fig.2-20 (a)) and the residual error of the predicted values and their deviation range with regard to the measured values in each progressive step (Fig.2-20 (b)) in the surface-based investigation. The confidence and uncertainty of the 3-D distribution of TDC in groundwater is effectively improved close to the area where a resistivity survey was done (Fig.2-20 (a)). The residual error approached zero with the data addition, but its deviation range did not improve. The result suggests that the uncertainty of a geological environment is difficult to eliminate by simple data addition and it is necessary to plan investigations considering other characteristics of the environment.
In future work, the resistivity survey in URL area will be repeated every year, and the constructed 3-D models of resistivity, TDC in groundwater and hydraulic conductivity will be verified and improved based on the results. Moreover, the extent of effects of the URL excavation will be estimated as well. This methodology is expected to be a useful tool to understand geological environments and their changes from the ground surface observations made in a pre-investigation state, during construction, and after closure of a real repository.

