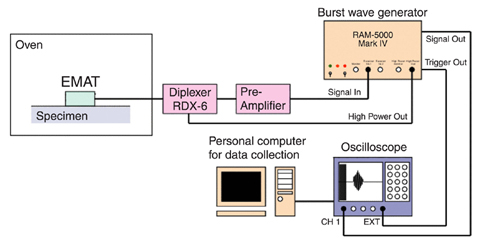
Fig.1-13 Measurement system
Table 1-3 Development target
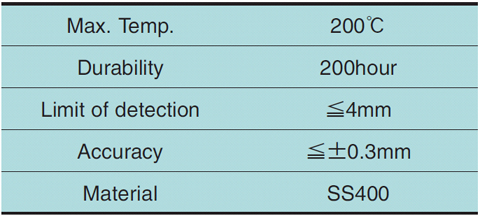
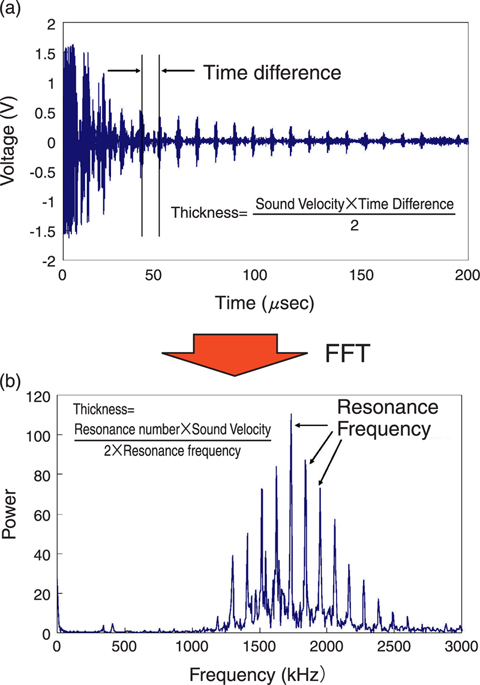
Fig.1-14 Measured Data
In nuclear power plants in Japan a periodical inspection has been carried out once every 13 months. However, maintenance activities and inspections are concentrated during plant shut down periods and tend to be fragmented. Also, there were indications that the required inspection interval was too long in some cases. To deal with these problems, a new inspection code (maintenance program) was carried out in 2009, in which the checking intervals have a scientific rationale.
Many of the past studies had focused on the condition-monitoring technique of active components such as a motor. However, there is also a high interest in the condition monitoring of passive components, such as a piping. For their monitoring, it is necessary to install a sensor with high temperature durability under the thermal insulator. Also, the sensor should be able to be manufactured with a low cost price.
In this present study an electromagnetic acoustic transducer (EMAT) composed of a permanent magnet and a coil were used. The sensor was specifically developed for a piping monitor. It excels in durability because EMAT has a simple structure, and also thus has a low price. Moreover, it is possible to attach it to the pipe using a permanent magnet. The pipe wall thinning monitoring sensor was developed to meet the targets described in Table 1-3. The data received from EMAT are taken to a computer as shown in Fig.1-13.
The sensor is detects multiple ultrasonic wave reflections in a wall, and thickness is calculated from the intervals between them (Fig.1-14(a)). The frequency composition of the reception signal can be analyzed to find resonance frequencies, which are used together with sound speed to calculate thickness (Fig.1-14(b)).
It was difficult to measure the thickness of thinner wall by the reflection time difference. It was also difficult to measure the thickness of a thick wall using the resonance frequency. This study was able to properly measure the wall thickness using different techniques applied to the same received data. By this method a 2mm board thickness was measured with±0.1mm accuracy, which is much better then the development target of 4mm±0.3mm. The sensor was confirmed to be usable at high temperature (200°C). In the future, it will be possible to enhance the safety of piping by installing these sensors on them.

