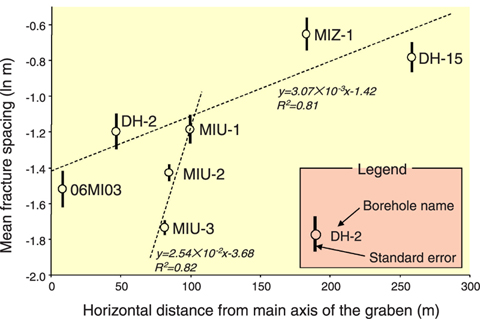
Fig.2-17 Scattergram between mean fracture spacing and horizontal distance from the main axis of a graben
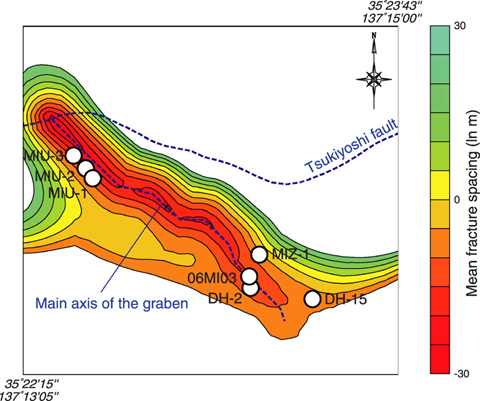
Fig.2-18 Contour map of estimated fracture density distribution (Tsukiyoshi fault line and the main axis line of a graben show trace lines on unconformity)
Since it has long been recognized that fractures in rock influence the distribution of groundwater flow and stress in the bedrock, determining the spatial distribution of fractures is important for deeper understanding of the characteristics of the bedrock. When extrapolations of the spatial distribution of rock fractures from limited borehole data are made, the extrapolation may be supported in areas with no data by empirical interpretations that geological engineers or researchers have made with information from previous investigations and the literature documenting the properties of similar geological environments. However, because empirical interpretation depends on knowledge, experience and capabilities of the geoscientists, it often lacks certainty. In this study, we attempted to develop an objective estimation method of distribution of fracture density applied to the Tono region (in Gifu prefecture, Central Japan), paying attention to the relative fracture density and distribution of geological structures (Tsukiyoshi fault and a graben on unconformity) determined by empirical interpretation. We established the following two working hypotheses on the assumption that the distribution of fracture density is related to the distribution of geological structures: (1) the fracture density increases with proximity to a fault and, (2) the fracture density increases with proximity to the intersection between faults. Secondarily, with the aim of confirming the working hypotheses, we examined the relationship between the horizontal distance from the geological structure to each borehole and the mean fracture spacing which was calculated from the distribution of fractures at each individual borehole and which was adopted as the index of fracture density.
As a result of this examination, we confirmed that there is a positive correlation between the mean fracture spacing and the horizontal distance from the geological structure to each borehole (Fig.2-17), and recognized that this correlation supports working hypothesis No.1. Moreover, working hypothesis No.2 is also supported, since the mean fracture spacing of boreholes (MIU-1 to 3) located close to the intersection of the Tsukiyoshi fault and the main axis of a graben is smaller than other boreholes, indicating that the distribution of fracture density is heterogeneous according to the distribution of geological structures. Such a heterogeneous structure of fracture density can be visualized as a contour map (Fig.2-18) reflecting the empirical interpretation, approximated as a trend surface by a first order polynomial function, allocating mean fracture spacing to geometrically calculated arbitrary points by entering the horizontal distance from the geological structures in the trend surface function.
The results of this study suggest that the geological phenomena which have been judged subjectively or uniquely by empirical interpretation can be represented objectively. Therefore, we consider that the analysis in this study is an effective method for extrapolation from limited spatial data to the heterogeneous distribution of characteristics of fractured rock such as fracture density.

