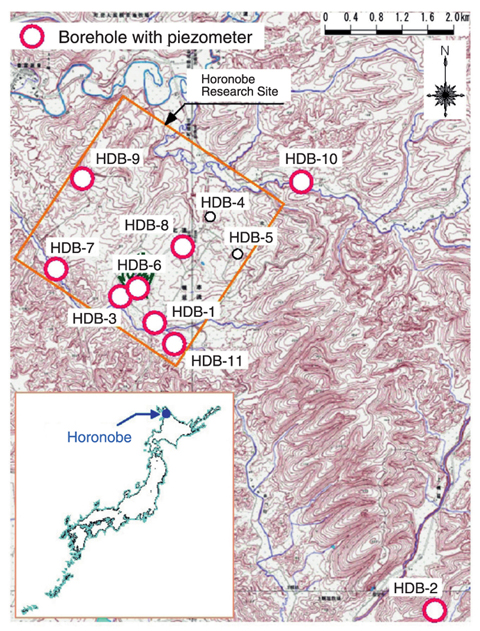
Fig.2-21 Borehole location map
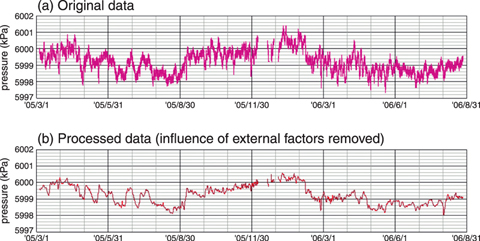
Fig.2-22 BAYTAP-G (Tamura, Y. et al., Geophysical Journal International vol.104, 1991), Example of groundwater pressure monitoring data (HDB-6: 585-620m in depth)
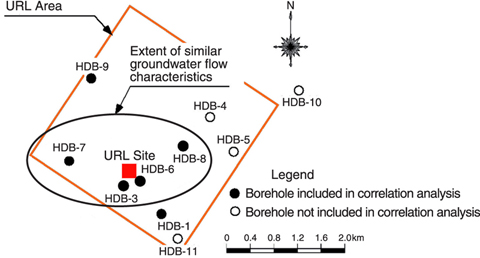
Fig.2-23 Image of area with similar groundwater flow characteristics (400m in depth)
Long-term groundwater pressure monitoring in the boreholes at Horonobe Underground Research Laboratory, Hokkaido, Japan was performed before the shaft excavation. The location of the monitoring boreholes is shown in Fig.2-21. Groundwater pressure around the shaft is expected to vary significantly due to the shaft excavation. Observation of the groundwater pressure variation will reveal the characteristics of groundwater flow and hydrogeological properties around the shaft.
An example of the groundwater pressure monitoring data is shown in Fig.2-22(a). This was collected from Mar. 2005 to Aug. 2006, before the shaft excavation. Pressure fluctuations due to atmospheric pressure variation and tidal forces were observed in the collected data. Such fluctuations can be removed by the well-known program called BAYTAP-G. Using this program, data analysis was performed for the data of 48 monitoring intervals.
Magnitude of the pressure fluctuation component due to tidal forces was from 0.01kPa to 0.08kPa, and that due to atmospheric pressure variation was from 0.05kPa to 0.6kPa. It was clear that the component of tidal forces was generally smaller than that of atmospheric pressure variation. Magnitude of the fluctuation in the groundwater pressure in the Horonobe area due to tidal forces is thought to be less than 0.1kPa. Distribution of the groundwater pressure which effects on groundwater flow can be obtained by removing such components from the observed pressure as shown in Fig.2-22(b).
Cross-correlation analysis was performed for the data sets after these components were removed. Relatively large cross-correlation coefficients were found among the HDB-3, HDB-6, HDB-7 and HDB-8 boreholes at around 400m in depth. This would imply that the characteristics of groundwater flow are quite similar around these boreholes shown in Fig.2-23.