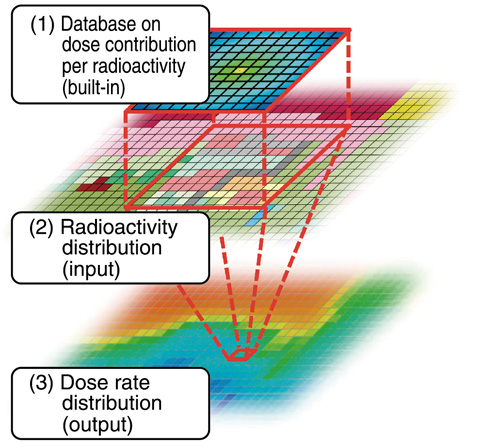
Fig.1-24 Concept of the dose calculation method in the CDE
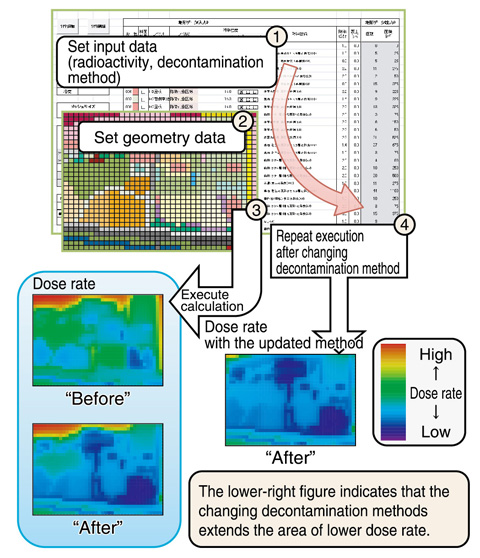
Fig.1-25 CDE for establishing a decontamination plan
For the reduction of dose rates in residential areas, it is necessary to remove the radioactive cesium deposited on the ground. Thus, a computer software program named Calculation System for Decontamination Effect (CDE) has been developed for planning the rational and effective decontamination of areas through the quick and accurate evaluation of dose rate reduction.
To achieve such a quick and accurate evaluation, the following calculation method was developed. First, the dose contributions per unit radioactivity to the surrounding region were evaluated using the three-dimensional particle transport code PHITS, which accurately treats the absorption and scattering reactions in air and on the ground, and the results were compiled in a response matrix constructed as a built-in database (Fig.1-24 (1)). Next, by multiplying the radioactivity distribution (Fig.1-24 (2)) by the response matrix, the dose rate distribution is calculated (Fig.1-24 (3)). While significant computation time is required to obtain accurate calculation results with PHITS, the CDE completes the calculation in a few seconds with comparable accuracy to PHITS. Therefore, the CDE successfully achieves a drastic reduction in the computation time.
The CDE runs on Microsoft® Excel® with a graphical user interface for easily proceeding through the evaluation steps, such as setting the input data, executing the calculation, and visualizing the evaluation results on a personal computer, as shown in Fig.1-25. Basic operations, such as copying digital data and saving evaluation results, are performed with the functions in Microsoft® Excel®.
The CDE has been distributed free as an open source software program on the Japan Atomic Energy Agency website beginning on November 2, 2011 (https://nsec.jaea.go.jp/en_index.html). The number of users was 452 at the end of March, 2012. The CDE was also utilized to predict the dose reductions used to assess the possible decontamination methods that could be used in Cabinet Office decontamination model projects for rural residential areas and evacuated zones.

