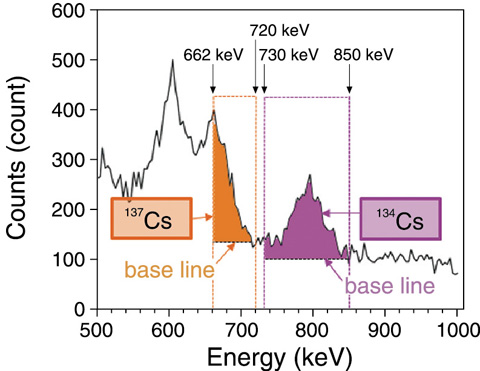
Fig.1-26 Scheme for selective quantification of 134Cs and 137Cs
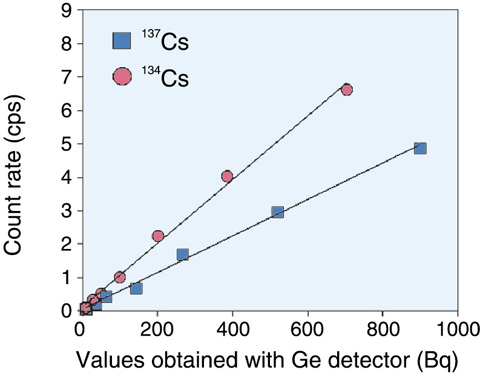
Fig.1-27 Correlation between nuclide concentrations in standard 100 mL-container and areas of specified parts
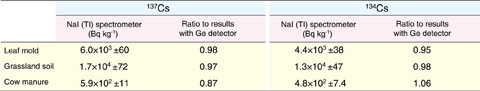
Table 1-4 Results of environmental samples
There is an increasing demand for analysis of the huge numbers of foods, soils, fertilizers, and so on contaminated by radiocesium (134Cs,137Cs). The NaI(Tl) scintillation spectrometer (NaI(Tl)spectrometer) and germanium semiconductor detector (Ge detector) are typical devices used for this purpose. The NaI(Tl) spectrometer has many merits, such as its lower price, smaller size, and easier handling compared to the Ge detector; as a result, its use is becoming common. However, it has a critical disadvantage in that it cannot distinguish completely between the γ-rays emitted by 134Cs and 137Cs. In this study, we aimed to establish a simple and open method by which producers and consumers can measure amounts of 134Cs and 137Cs separately using a NaI(Tl) spectrometer. We consider it is important to provide a common basis for more reliable analysis for use by many nonprofessional people.
Common NaI(Tl) spectrometers exhibit energy spectra with overlapping gamma ray peaks for 134Cs and 137Cs when a contaminated sample is analyzed (Fig.1-26). We determined two regions within the peaks, each specific to either 134Cs or 137Cs (Fig.1-26, colored parts). It was theoretically estimated that, approximately, the area of each region is affected by neither the other nuclide nor 40K, a natural radionuclide. The output of the spectral data file is available as a spreadsheet in many commercially produced NaI(Tl) spectrometers. We summed the total counts in the specified regions and calculated the count rate (cps) by dividing the total counts by measurement time (seconds), and found that the results accurately reflected the amounts of 134Cs and 137Cs in the sample (Fig.1-27). Several environmental samples were subjected to this method and the results exhibited high consistency with values obtained using a Ge detector for the respective nuclides; this demonstrates the applicability of our method (Table 1-4).
The linearity of the dilution series (Fig.1-27) and the abundance ratio between 134Cs and 137Cs (Table 1-4) may reflect the accuracy of the measurements; thus, users can check their preparation procedures. We expect the method described here to contribute to reliable analysis conducted by a wide variety of people.

