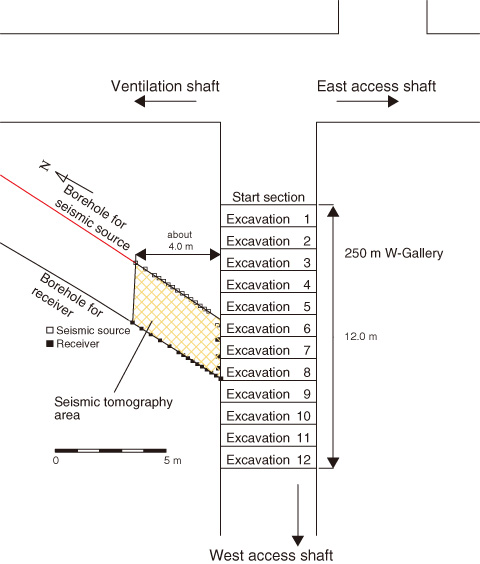
Fig.3-10 Layout of the seismic tomography
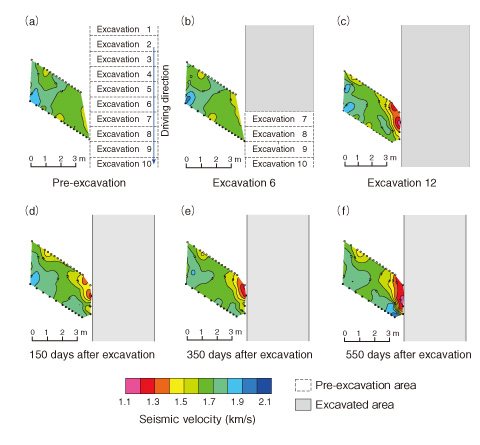
Fig. 3-11 Results of seismic tomography survey
In response to the excavation of an underground opening, the host rock properties such as the rock strength and permeability are expected to change. The resulting zone is called the excavation damaged zone (EDZ). In geological disposal of high-level radioactive waste, an EDZ is expected to provide critical pathways for radionuclides. Therefore, it is important to develop a technique for quantitative assessment of the EDZ.
To investigate the EDZ, seismic tomography surveys have been widely conducted in the field. This technique investigates the seismic velocity in rock by measuring the travel time of seismic waves. When a seismic wave passes through fractures in rock, its velocity decreases. In this study, we estimate the extent of the EDZ on the basis of the decrease in seismic wave velocity at the Horonobe Underground Research Laboratory.
Fig.3-10 shows a plan view of the layout of the seismic tomography in a gallery at a depth of 250 m. Seismic tomography was conducted at the 250 m W-Gallery during excavation (Excavations 1 to 12) and after the excavation of the gallery was complete. Fig.3-11 shows the results of the seismic tomography survey. In the pre-excavation and Excavation 6 stages, shown in figures (a) and (b), the seismic velocity did not change remarkably. In Excavation 12, shown in figure (c), a low-velocity area in which the velocity decreased to around 1.3 km/s developed about 1.0 m into the gallery wall. After the gallery was completely excavated, the low-velocity area was smaller at 150 days after excavation, as shown in figure (d), but had expanded again at 350 and 550 days after excavation, as shown in figures (e) and (f), respectively. Consequently, it was found that the EDZ can be expected to develop about 1.0 m into the gallery wall and that the extent of the low-velocity area changes with time.
We aim to examine the long-term change in the low-velocity area in detail. In addition, we will conduct permeability tests and measure the saturation around the tomography area to investigate the change in the hydrogeological properties in the EDZ.

