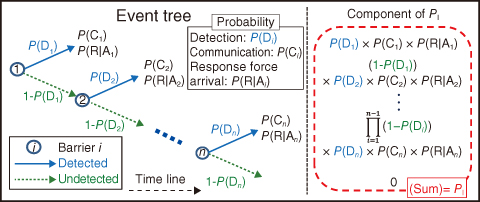
Fig.11-2 Schematic of the EASI method
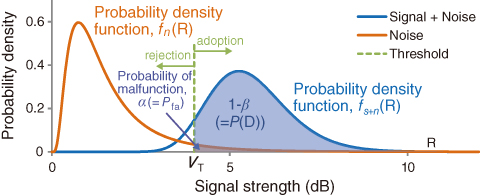
Fig.11-3 Probability distribution functions P(D)
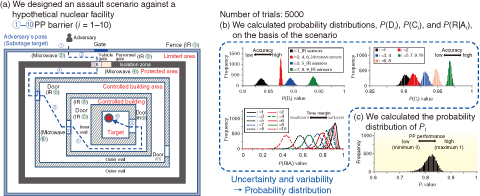
Fig.11-4 Example of PI assessment in an assault scenario
Since the September 11, 2001 attacks, it has become increasingly necessary to consider the physical protection (PP) of nuclear materials against adversarial attacks, i.e., sabotage against a nuclear facility. It is important to assess PP performance when one is designing or implementing PP measures. In general, this is qualitatively evaluated; however, if it is quantitatively assessed, including its uncertainty and variability, it might be possible to provide better PP measures.
In this study, we focus on establishing a quantitative expression for the probability of an adversary being interrupted, PI, to assess PP performance. A simple calculation describing PI in an Estimate of Adversary Sequence Interruption (EASI) is shown in Fig.11-2. The left side of this figure indicates a simplified event tree diagram for the PI calculation at the i point barriers, and the right side indicates the calculation components of PI. P(D) is the probability of a detection alarm (e.g., infrared (IR) sensors) being triggered; P(C) is the probability that the facility guard successfully interprets the alarm condition using the PP equipment and successfully communicates with the response force; and (P(R|A)) is the conditional probability that the response force arrives prior to the completion of the adversary’s action sequence by recognizing the alarm.
In the EASI calculation, both P(D) and P(C) values are considered as the evaluated values without uncertainty and variability, and the P(R|A) value is calculated using a normal distribution. To assess the PP performance more realistically, we develop a new quantification method for PI that expands EASI by expressing the influence of uncertainty and variability as a probability distribution.
First, we express P(D), as shown in Fig.11-3, using the statistical type II error (β). P(D) is the distribution function area where the probability density function of the signal and noise (fs+n) exceeds a threshold value (VT). Second, we express the human error affecting P(C) using a log-normal distribution. Third, we re-define P(R|A)) using the Poisson distribution to show the margin of error in the response force arrival caused by uncertainty and variability.
We design a hypothetical assault scenario and assess PI, as shown in Fig.11-4. Furthermore, all components of PI are calculated from data based on the scenario. Moreover, the data’s uncertainty and variability are expressed by normal random numbers. Consequently, we can quantitatively assess PI using our new method.
<Previous: 11 Development of Science & Technology for Nuclear Nonproliferation | Next: Promotion of Collaboration >

