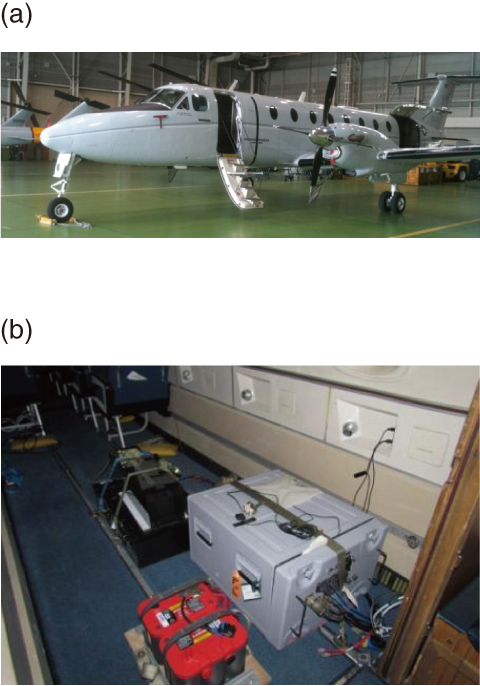
Fig.1-4 Airplane used for the airborne monitoring (a), and the measurement instrument comprising three embedded NaI scintillation detectors (b)
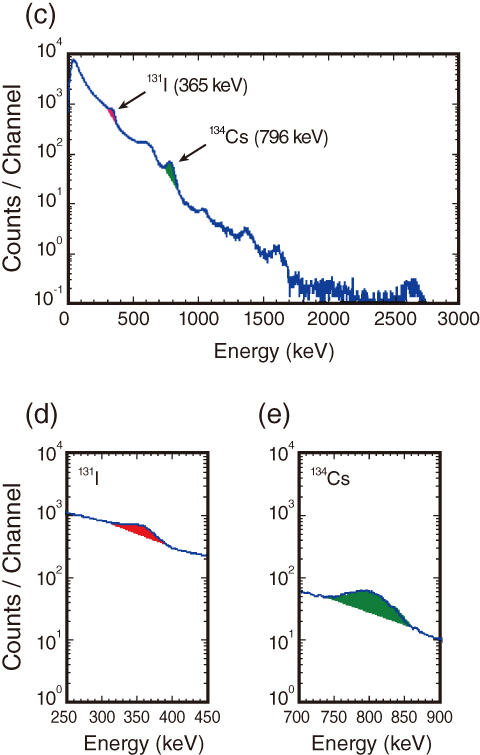
Fig.1-5 Spectral data
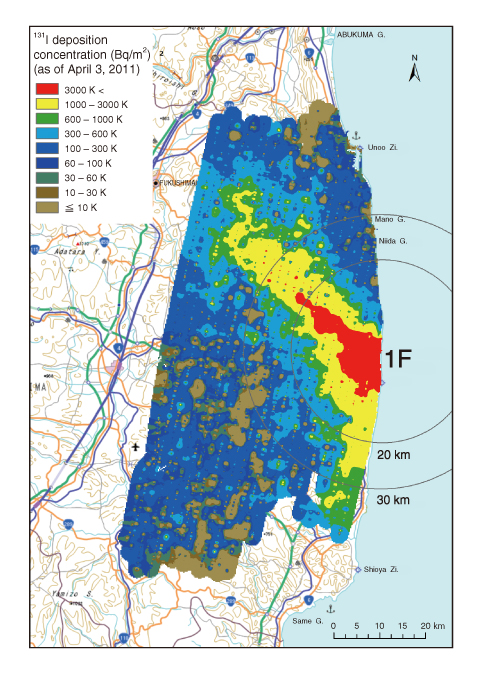
Fig.1-6 131I deposition distribution (as of April 3, 2011)
Radioactive substances were spread across a wide area in the aftermath of the accident at the TEPCO’s Fukushima Daiichi NPS (1F).
We obtained the airborne monitoring data that was collected by the U.S. Department of Energy National Nuclear Security Administration (DOE/NNSA) at an early stage, March 17 to April 5, 2011 (Fig.1-4), and analyzed the spectral information in a joint research project with DOE/NNSA (Fig.1-5). Within this data, the energy peak corresponding to iodine-131 (131I) was observed. DOE/NNSA and we have developed a new method for analyzing 131I to determine the ground deposition concentrations and create distribution maps.
Our main focus was on three airborne monitoring flights on April 2 and 3, 2011, and the energy peak (365 keV) of 131I (Fig.1-5(d)). The deposition concentrations of 131I were analyzed by developing a method for calculating the response to ground deposited activity at varying aircraft heights. This was conducted using Monte Carlo simulations, which extract the iodine peak and simulate the attenuation of γ-rays in the air.
From this analysis, the 131I deposition distribution was determined, and its maps were created. Fig.1-6 shows the distribution of 131I depositions at varying concentrations, corrected for radioactive decay up to April 3 when monitoring was completed.
Analysis of cesium-134 (134Cs), which has a longer half-life, was conducted using the same method as that for 131I. Consequently, high concentrations of 131I, 134Cs, and cesium-137 (137Cs) were shown to be present to the northwest of 1F. In the area south of 1F, high concentrations were also detected.
To verify the validity of the method, a comparison was performed with the Japanese Ministry of Education, Culture, Sports, Science and Technology (MEXT) Emergency Operation Center’s (EOC’s) soil sampling data (131I, 134Cs) taken on June 14, 2011. The results from the present analysis were corrected for radioactive decay for the purposes of this comparison. The deposition concentrations of 131I and 134Cs measured on the ground agreed well with the airborne monitoring results. This newly developed method showed the detailed distribution of 131I.

