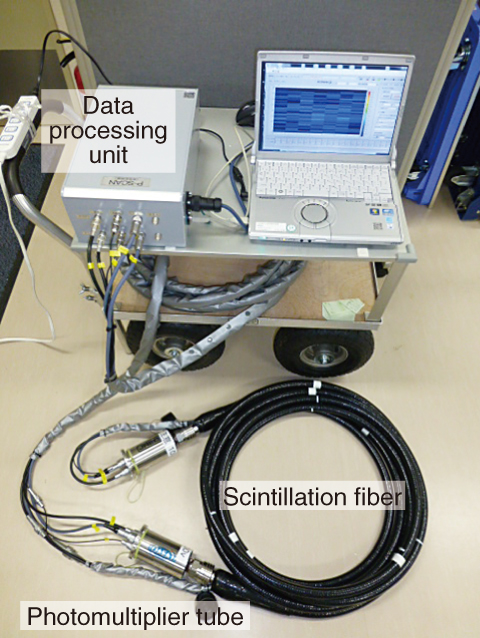
Fig.1-7 A radiation measuring system for the bottoms of water bodies using PSF
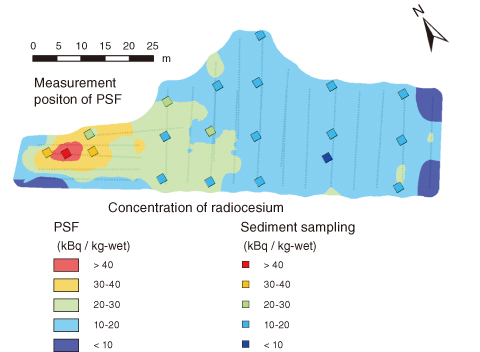
Fig.1-8 Example of a radiocesium distribution map of an irrigation pond in Fukushima Prefecture
There are approximately 3700 irrigation ponds in the Fukushima prefecture. Contamination by radiocesium at the bottom of these ponds has been a concern since the accident at the TEPCO’s Fukushima Daiichi NPS (1F). The irrigation ponds collect the water that falls in the catchment area as rain, which is then used for agriculture. In general, the radiocesium concentration in sediment is evaluated by measuring collected samples in a laboratory. The drawback of this method are that the samples become radioactive waste. In addition, the evaluation of the distribution of over the entire irrigation pond is difficult. In Fukushima, a quick and direct technique for measuring a wide area of the bottom of a pond is needed.
We developed the plastic scintillation fiber (PSF) following the accident at 1F. PSF has the following characteristics, (1) a detector is long (max.20 m). (2) the water resistance of the detector is high, and (3) PSF can be put along the measuring object. Therefore, PSF was applied to the measurement of irrigation ponds. A photo of the radiation measurement system based on PSF is shown in Fig.1-7. PSF is an optical fiber with a plastic scintillator at its core. Optical sensors (photomultiplier tubes) were located at both ends of the optical fiber, and the amount of radiation was measured. In addition, the position at which radioactive emission took place was pinpointed based on the difference in the times at which the two sensors counted it. The count rate collected by PSF was used to extrapolate the radiocesium concentration at the bottom of the pond by the results to those taken by waterproof γ-ray spectrometer that was calibrated by Monte Carlo calculation code. The assumption under which the radiocesium concentration was extrapolated was that radiocesium was distributed uniformly over 10 cm from the surface layer of the sediment. There is good agreement between the concentration extrapolated from PSF data and that obtained from sediment core samples. Using this method, measurement of an irrigation pond 1000 m2 in area took about four days (with five people to each team). An example of a radiocesium distribution map obtained from an irrigation pond in Fukushima is shown in Fig.1-8. The PSF measurements were performed at a line spacing of 5 m. The map was created using the interpolation method known as Kriging. This map accorded with the result obtained by sediment sampling.
We are transferring these techniques to Midori Net Fukushima (http://www.midorinet-fukushima.jp) by making a technical support contract with them. JAEA is going to develop the technology and provide the support that is necessary to utilize these techniques for the measurement of radiocesium in irrigation ponds in Fukushima.

