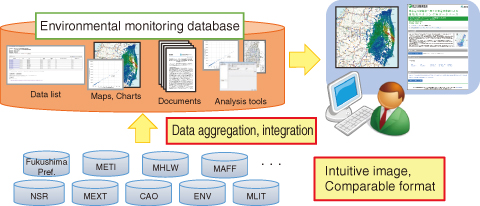
Fig.1-11 An environmental monitoring database system
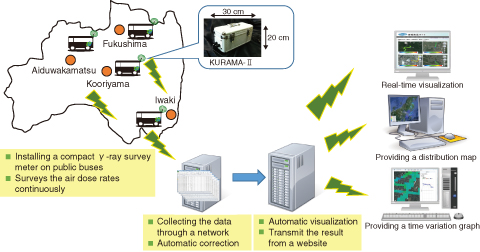
Fig.1-12 A real-time visualization system for the distribution of air dose rates in the Fukushima Prefecture
To estimate the impact of radionuclides emitted by the accident at the TEPCO’s Fukushima Daiichi NPS, it was necessary to identify the current distribution of radionuclides and the tendency of this distribution to change in time. We conducted research projects to provide environmental monitoring data, which were essential for these identifications.
One of the research projects was the development of an environmental monitoring database. Many kinds of environmental monitoring data collected by ministries, agencies, and local governments have previously been published in different formats. We republished the data in a uniform fashion by developing a tool to integrate them automatically, thereby improving data usability and compatibility (Fig.1-11). Over 300 million records of data published by 21 organizations were republished. The average number of accessing the new database was 2.5 times larger (about 166 thousand accesses) than the former database, which was developed under a previous MEXT project.
In cooperation with the Fukushima Prefecture and Kyoto University, we conducted another research project that provided real-time visualization of the air dose rate data monitored by the compact γ-ray survey system (KURAMA-Ⅱ). Because of its limited budget, air dose surveys with KURAMA-Ⅱ have only been conducted a few times before. The use of public buses that run in residential areas on a daily basis and of servers that collect, compensate, and visualize the data automatically made real-time data provision possible (Fig.1-12). Furthermore, just in case a similar accident occurs, it is expected that this system can provide data in real time. Real-time visualized air dose rate data is now available on a large monitor in the NBF Unix Building near Fukushima Station.
This present study was partly sponsored by the Nuclear Regulation Authority (NRA), and by the Fukushima Prefecture.

