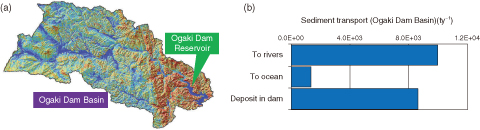
Fig.1-13 (a) The Ogaki Dam Reservoir (map drawn using DEM data provided by the Geophysical Survey Institute) and (b) the simulation results for the amount of sediment movement in the basin
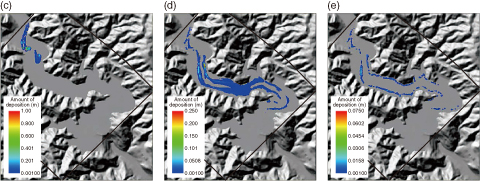
Fig.1-14 Examples of sediment deposition in terms of (c) sand, (d) silt, and (e) clay on the reservoir bed (map drawn using DEM data provided by the Geophysical Survey Institute)
Radioactive cesium (Cs), which was deposited on land after the accident at the TEPCO’s Fukushima Daiichi NPS (1F), adheres strongly to soils, especially if they are rich in clay. Its migration is mainly caused by soil erosion and sediment transport within surface water during times of widespread flooding. Although the alleviation of all sediment movement is impossible, adequate operation of dam reservoirs may mitigate the dispersion of sediment-absorbed radioactive Cs.
We simulated the movements of sediment and radioactive Cs in the Ogaki Dam Reservoir in Fukushima Prefecture using several simulation models to understand sediment migration behavior during floods. We chose this reservoir because it is located in the middle of the Ukedo river, the river which was most affected in terms of radioactive Cs by the accident at 1F.
Fig.1-13 shows the Ogaki Dam Basin and the simulation results for the amount of sediment that entered into the river system, exported to the ocean, and deposited on the reservoir bed. This simulation was performed using our watershed model, the Soil and Cs Transport model. As can be seen from the figure, almost all of the sediment that entered the upstream part of the river was eventually deposited on the reservoir bed.
Fig.1-14 shows the results for the amounts of sand, silt, and clay that were deposited on the reservoir bed 3 days after a typical flood event. This simulation was performed with the Nays 2D code. Almost all the sand and silt was deposited on the reservoir bed. However, because of the size difference, the locations of the largest deposits of each sediment grade differed. The sand was mainly deposited near the entrance of the reservoir and the silt was deposited almost everywhere under consideration. Clay, on the other hand, remained suspended in the reservoir for longer. More than half of it was eventually deposited on the reservoir bed, while the rest left the reservoir and flowed downriver in our simulation.
In addition, we have simulated the same problem using different water heights within the reservoir. When the water level was lowered, the sand and silt generally behaved in the same manner as above. However, more than half of the clay passed through the reservoir and flowed downstream in a shorter time than it took in the previous case. The results indicate that adjusting the water height in the reservoir may provide a countermeasure against radioactive Cs migration from, or accumulation in, the reservoir. At present, intensive field investigations are ongoing with the goal of validating our simulation results and refining the model as necessary.

