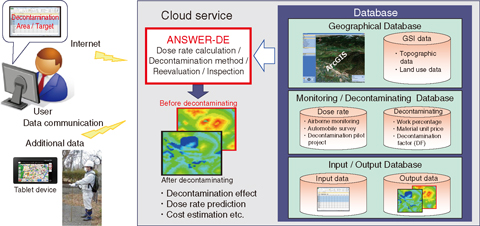
Fig.1-15 Restoration support system for the environment, “RESET”
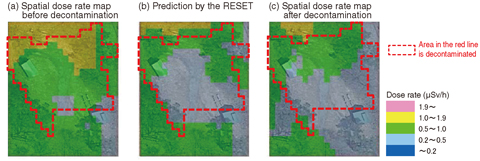
Fig.1-16 Comparison of decontamination results and prediction by RESET
To restore the environment polluted by the accident at the TEPCO’s Fukushima Daiichi NPS, energetic decontamination has been implemented in the communities within 11 special decontamination areas (comprising the 20 km restricted area and the evacuation areas) and 97 intensive contamination survey areas (with radiation backgrounds of 1 mSv/year or more). We constructed an office in Fukushima City and have been technically supporting the Ministry of the Environment (MOE) and local governments in decontamination of the areas since June 2011.
RESET (Fig.1-15) was developed to support MOE and local governments for planning and efficient and effective implementation of decontamination. Since RESET is constructed on a cloud computer, users who can connect to the Internet using a WEB browser can perform a quick and highly precise prediction calculation. RESET has a database that has the airborne monitoring and the automobile survey data published by the Nuclear Regulation Authority (NRA) Japan, electronic topographic data, and land-use data of the Geospatial Information Authority of Japan (GSI). We can easily input data using the database. After inputting the spatial dose rate at a height of 1 m measured before decontamination into RESET, the surface pollution density and spatial dose rate at a 1 m height after decontaminating are calculated by considering 3-dimensional geographic effects using ANSWER-DE, which is a spatial dose rate calculation program included in RESET.
We introduce a simulation result for decontamination of a campsite in the Fukushima Prefecture as an example. Fig.1-16 shows a comparison of the spatial dose rate maps measured before decontamination, as predicted by RESET and measured after the fact. Since the effect of decontamination can be visualized for ease of understanding, as in these figures, it can be used to study efficient decontamination methods and risk communication for residents in the area.
RESET is now used by MOE, the Fukushima prefectural office, and 12 towns and villages, and we are using RESET in responding to requests by local and national governments for advice and technical guidance on the implementation of effective decontamination, predicting dose rates in the future, and studying effective decontamination methods for an area. We are planning to apply RESET to higher-dose rate areas such as resident restricted areas and areas to which return is difficult, as well as forests, which accounts for 70% of the area of Fukushima Prefecture.

