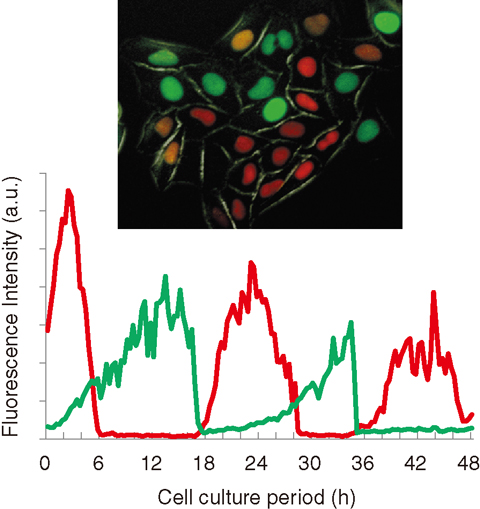
Fig.3-10 Timecourse of the fluoresce profile of HeLa-Fucci cells
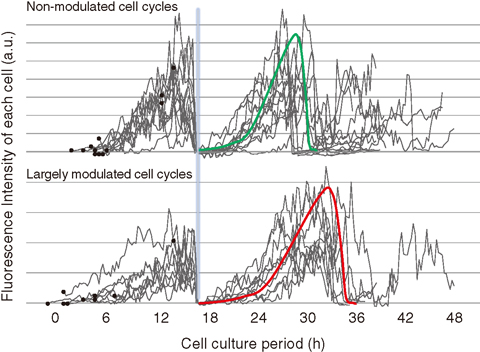
Fig.3-11 Timecourse of the fluorescence of irradiated cells relevant to cell cycle progression
Recent advances in microscopic live cell imaging technologies with cell-labeling indicators have enabled us to easily observe cellular functions with dynamics. The obtained dynamic images include the information within individual cells. This is of great advantage to us because conventional methods afford only static images or statistical averages of functional molecules biochemically extracted from populations of cells, and hardly provide us with dynamic cellular functions. Using a time-lapse imaging technique, we have investigated cell cycle modulation induced by ionizing irradiation.
Cell divisions of mammalian cells, including human cells, constantly undergo a cell cycle. The exposure to ionizing radiation, however, affects the cells to cause cell cycle delay or arrest. This is thought to be controlled by the so-called “check point mechanism” with various proteins to ensure the repair time of genomic DNA damage, although the details have not yet been clarified, particularly concerning whether all cells undergo cell cycle delay over a similar period when exposed to the same dose or how the cell cycle delay recovers to its normal value.
Using HeLa-Fucci cells showing their cell cycle stages with specific colors (Fig.3-10), we have performed time-lapse observations to track individual cycles of cells on a culture dish after X-ray exposure of 5 Gy, which causes inactivation of cell division for 99% of the irradiated cells. The results show that the cells could undergo about two cell divisions within 48 h. Furthermore, tracking the cell nucleus colors for 20 cells revealed that the cells were possibly separated into two populations: those with modified and with hardly modified cell cycles (Fig.3-11). These results indicate that there is a novel mechanism underlying the appearance of the two types of cell populations by switching the cell cycle from “ON” to “OFF” states and the output to 0 or 1. Understanding such digitally cellular responses might be a breakthrough for studies on the diverging point in the loss of cell division or surviving with mutation.
A part of this study has been performed as a Joint Research Program between the graduate school of Ibaraki University and JAEA.

