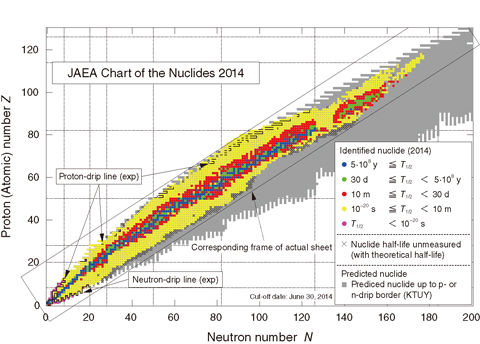
Fig.3-12 Overview of the JAEA Chart of the Nuclides 2014
Fig.3-13 Cover page
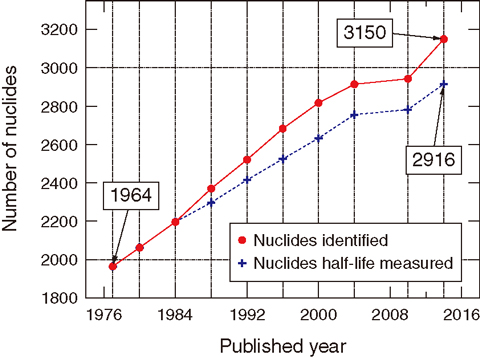
Fig.3-14 Transition of the number of identified nuclides
All the materials found on Earth are made of atoms, with each atom composed of electrons and a nucleus. A nucleus is ten thousand times smaller than an atom and is composed of protons and neutrons. The combination of protons and neutrons determines properties of the nuclei, such as stability and nuclear decay. What is the relation between this combination and the decay properties, and how many combinations are available?
Nuclear physicists have synthesized various nuclei with combinations of protons and neutrons and investigated nuclear properties to answer these questions. To represent the properties of various nuclei, nuclear physicists have made a chart of nuclei, where the number of protons is shown on the vertical axis and the number of neutrons is shown on the horizontal axis like a map.
We have also published such a chart on a regular basis since 1977, and we have now revised the chart as the “JAEA Chart of the Nuclides 2014”, with major upgrades since the previous version in 2010 (Figs.3-12 and 3-13).
This chart includes the latest 3150 experimentally identified nuclides, and the evaluated half-lives and decay modes of 2916 of them. The number of nuclei added since 2010 is approximately two hundred, and approximately one thousand isotopes have been discovered and identified over nearly forty years (Fig.3-14).
The unique feature of this chart is that decay data for unmeasured nuclei (1578 points) have also been presented based on calculations using nuclear theory. Furthermore, nuclei with extremely short half-lives (less than 10−20 s) have been newly added, and neutron and proton drip lines are also drawn. These data provide useful information for nuclear experiments worldwide.
This chart has been used in high-school lectures and science cafes for the general public to understand nucleosynthesis in the universe and atomic energy related to various phenomena of nuclei such as nuclear transmutation.
<Previous: 3-6 | Next: 4 Nuclear Science and Engineering Research >

