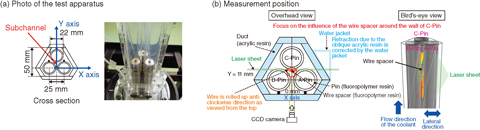
Fig.7-8 Three-pin bundle water experiment system
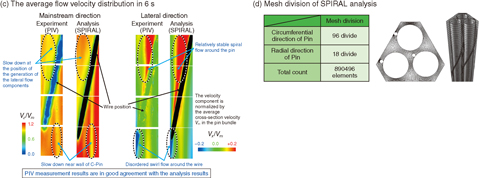
Fig.7-9 Comparison between PIV measurement results and analytical results
Fuel pins are generally densely arranged in equilateral triangles in the fuel subassemblies of sodium-cooled fast reactors. The spiral wire spacers are adopted to maintain gaps in the fuel pins and to ensure cooling because they can be relatively flexible to deformation of fuel pins caused by neutron irradiation. However, the coolant flow path between the fuel pins might become a narrow, complex shape due to the installation of the wire spacer. Then, the fuel pin could be damaged if a mismatch between the output and the flow rate occurred by some event such as deformation of the coolant flow path for the high burn-up. To evaluate the structural integrity of the fuel pins, it is important to clarify the flow field in this narrow and complex flow path. However, no techniques have been developed for visualizing such a narrow and complex area to obtain the verification data of the analysis codes in past studies.
The flow field was measured by particle image velocimetry (PIV) in the subchannel around the wrapping wire of the three-pin bundle water model (Fig.7-8(a)), which simulated the simplest system of the fuel pins (Fig.7-8(b)) in this study.
The test section comprised an irregular hexagonal acrylic duct tube and fluoropolymer resin pins that had nearly the same refractive index as that of water and had a high light-transmission rate. This refractive index matching enabled us to visualize the inner subchannel through the outer pins with a high degree of accuracy.
As a result, two types of characterized flow field data (the flow velocity distribution and fluctuation intensity) were successfully obtained. One is a relatively stable spiral flow around the pin and the other is a disordered swirl flow around the wire. As an example, the experimental (Fig.7-9(c)) and analytical results obtained by SPIRAL (a finite element analysis code) (Fig.7-9(d)) for the flow velocity distribution near the wire wound on the C-Pin are compared. The two results are in good agreement, and are hence considered to have verified the efficacy of this code.
Verification and validation (V&V) research has focused on the development of a safety assessment analysis code for nuclear power facilities, especially in recent years. Standardization of V&V has been underway in Japan and overseas.
In this way, the results of this study contribute to the promotion of fast reactor development by helping to validate analysis codes as basic technology and to the establishment of a standard for V&V.

