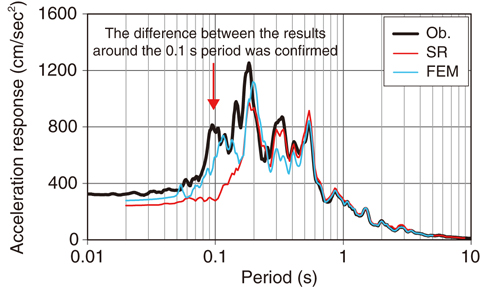
Fig.10-2 Comparison between observed data and analytical results obtained using the SR and detailed 3D models (acceleration-response spectrum, EW direction, 2nd floor)
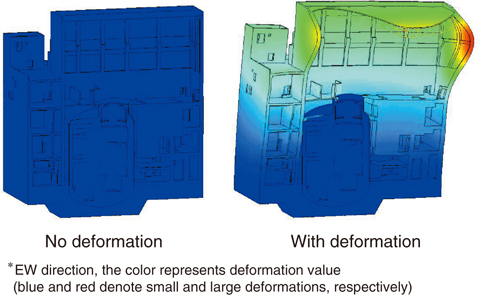
Fig.10-3 An example of vibrational mode of the detailed three-dimensional model of the HTTR building
We have constructed a framework called three-dimensional vibration simulator for seismic-response simulation using a detailed three-dimensional model (3D-FE model) of large, complicated structures such as nuclear power plants. In order to verify the applicability of this three-dimensional vibration simulator to actual problems, we compared the analytical results obtained with the SR model (which is a model meant for design) and with the 3D-FE model using acceleration records observed at the HTTR building at JAEA’s Oarai site (Fig.10-2).
First, we compared the analytical results obtained using the SR model and the acceleration response of seismic-observation records. The results enabled us to confirm the difference between the analytical results and seismic-observation records in a short period range of approximately 0.1 s. To identify the cause, we analyzed the vibration of 0.1 s period based on seismic-observation records. We then confirmed the vibrational mode of the coupled deformations in the horizontal and vertical directions, which it is impossible to represent using the SR model. Next, we created a detailed three-dimensional model of the HTTR building to reproduce the vibrational mode and conducted similar seismic-response analysis using a three-dimensional vibration simulator. This confirmed the consistency between the analytical results and observational records of the acceleration-response spectrum; it also confirmed the existence of a coupled vibrational mode in the horizontal and vertical directions (Fig.10-3).
In the SR and detailed three-dimensional models employed in this study, the major modes of the vibrational effect upon the seismic response (approximately 0.2-0.4 s) are largely identical. Because the confirmed coupled vibrational mode has a relatively short period of approximately 0.1 s, the contribution to acceleration response is marginal and the effect on the maximum acceleration to be employed in the seismic evaluation was insignificant. However, as can be observed in Fig.10-3, because vibrational modes affect local responses, especially of the upper walls of the building and the roof, it is necessary to consider the vibrational mode in the stress evaluation of such components.
Since the Great East Japan Earthquake, seismic evaluation of nuclear facilities has required seismic-margin assessment beyond the design value for a variety of ground motions. For this purpose, a more reasonable response evaluation is necessary. An SR model is a model with an adequate margin; however, for highly accurate response evaluation, it is important to construct a model capable of reproducing the actual phenomena. In this research, we will continue the analysis of various seismic-observation records and conduct research and development toward the advancement of a seismic-evaluation method for nuclear facilities.
<Previous: 10 Computational Science and E-Systems Research | Next: 10-2>

