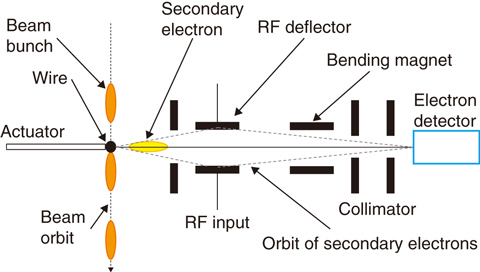
Fig.5-7 Principle of the bunch-shape monitor
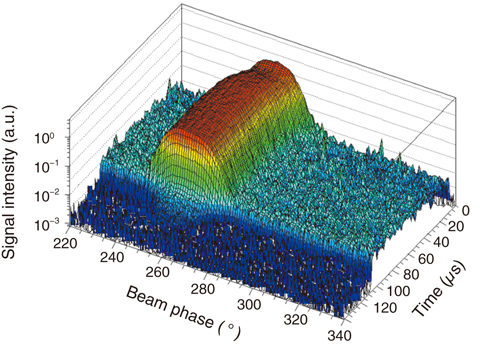
Fig.5-8 Waveform of the phase distribution
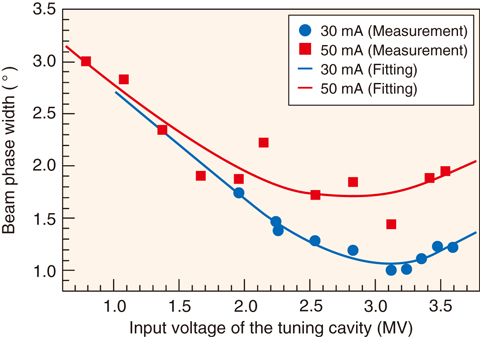
Fig.5-9 The dependence of phase width upon tuning-cavity amplitude
At J-PARC, the linac, which serves as the injector for the 3-GeV synchrotron, accelerates a negative-hydrogen-ion beam (H−) to obtain a 400-MeV beam energy. For radio-frequency (RF) accelerators, a beam-phase monitor for the centroid phase-measurement device is usually employed to determine the set point of the RF phase. We use an accelerating frequency of 324 MHz for the cavities in the middle of the linac and of 972 MHz for the downstream linac cavities. Because the high-brightness accelerators at J-PARC should suppress beam loss (which leads to radiation during operation and the activation to the machine components), both the centroid-phase set point at the frequency jump from 324 MHz to 972 MHz and the phase-width control are key issues for suppressing the excess beam loss. We developed a bunch-shape monitor (BSM) to measure the phase width as well as a tuning strategy to minimize the beam loss below 1 W/m along the linac beam line.
Fig.5-7 shows a schematic view of the BSM. The device is based on secondary electrons emitted from an interaction between the beam and tungsten wire. Because the secondary electrons are generated rapidly and retain their original phase distribution, the device can obtain the phase distribution of the charge in bunches by adjusting the phase of the deflecting field. Fig.5-8 shows the waveform of the phase distribution. The time duration of a pulse length is 100 μs and the Gaussian distribution can be obtained every 1 μs. We define the root-mean-square (rms) phase width by the standard variations calculated from the distribution. Amplitude-scanning results of the tuning cavity, which is located in front of the bunch-shape monitor, is shown in Fig.5-9. Once the phase width is decreased on the amplitude of the tuning cavity, because the bunching force depends on the gradient of supplied RF. As per the theory of geometric optics, the focalusing point is shifted closer to the tuning cavity and over-focusing occurs owing to the excess amplitude. We compare these curves with a beam-dynamics simulation and estimate the optimal set point of the amplitude of the tuning cavity. This tuning suppresses the beam loss within 1 W/m along the linac beam line.
BSMs are presently used at high-brightness accelerator facilities around the world. We proposed to use the phase-width measurement and refer to beam-dynamics simulations to obtain the optimal amplitude of the tuning cavity at the frequency-jump point. This validated the suppression of the beam loss and established a new cavity-tuning method.

