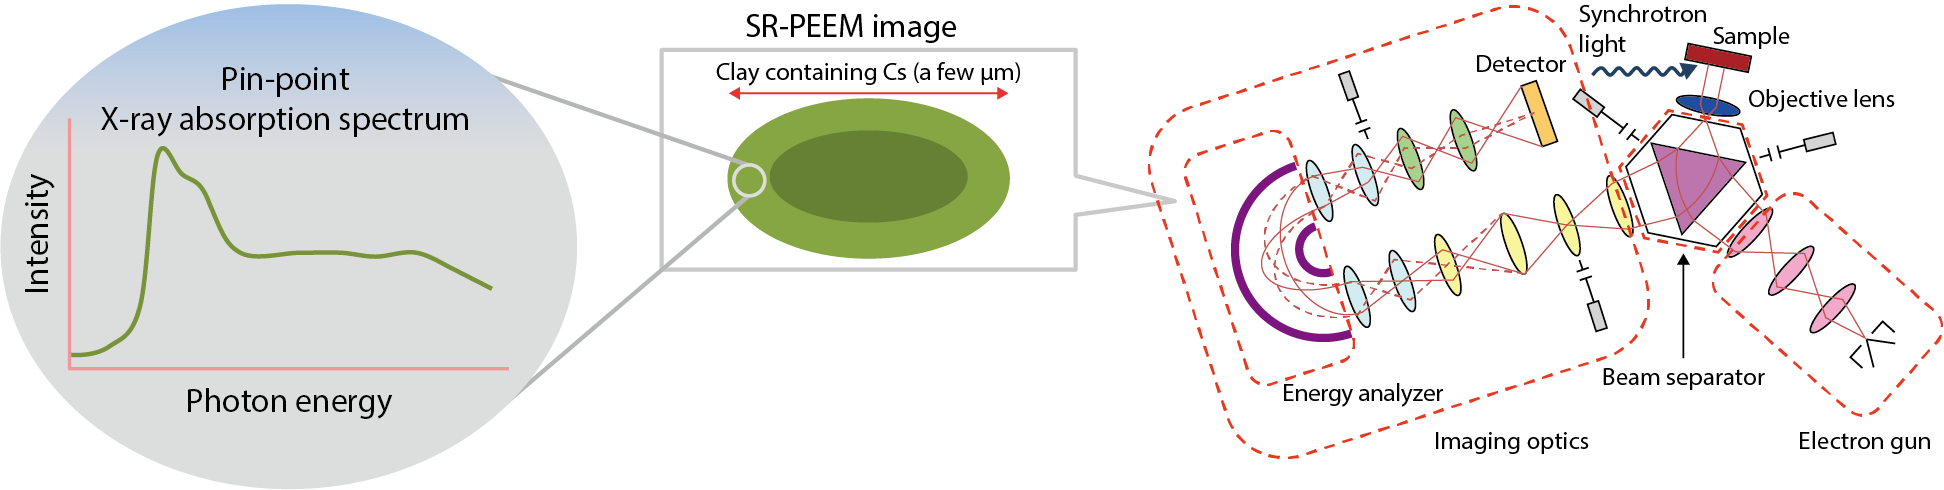
Fig.1-38 Diagram of nanoscale chemical analysis for Cs in clay particles
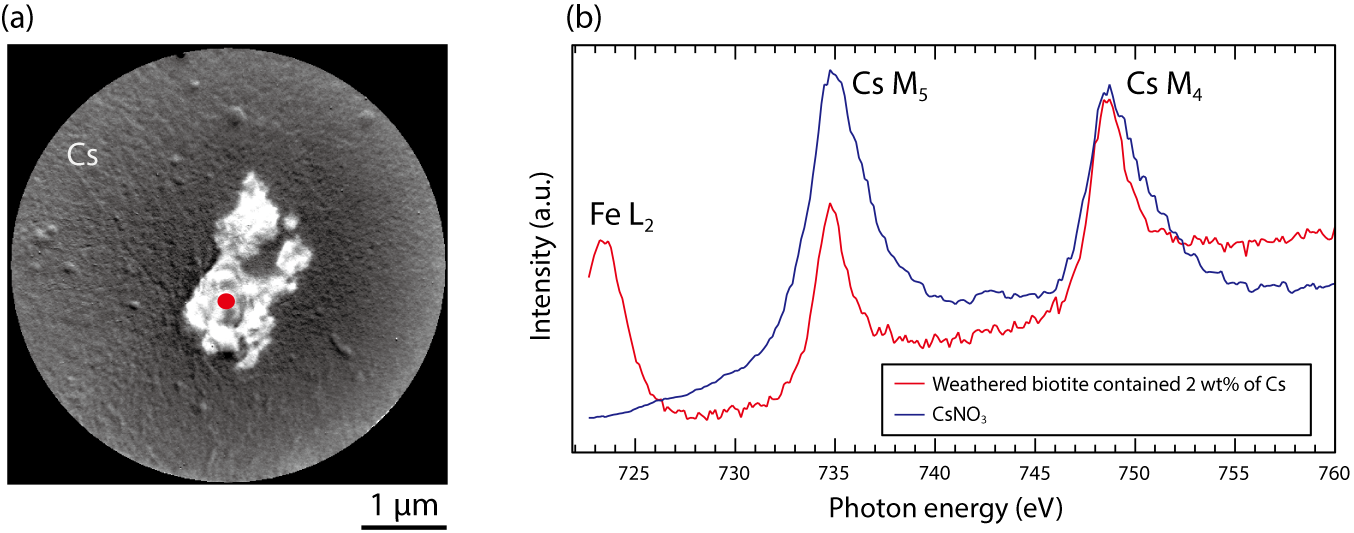
Fig.1-39 (a) SR-PEEM image of weathered biotite containing 2 wt% Cs and (b) Comparison of the X-ray-absorption spectrum between weathered biotite containing Cs and CsNO3
It is known that radioactive cesium (137Cs) is present at the soil surface and strongly adsorbed to clay minerals following the accident at the TEPCO’s Fukushima Daiichi NPS. A basic understanding of Cs adsorption and removal is required to develop a decontamination method with a low environmental load. However, it is not easy to study the adsorption behavior of Cs because the clay contains an extremely small amount of Cs with an irregular size of less than several microns. Synchrotron-radiation-photoemission electron microscopy (SR-PEEM) is an analytical technique that can visualize the chemical state of individual elements with nanoscale spatial resolutions (Fig.1-38). Despite its superiority to other methods, a significant problem called charging arises for an insulator sample, e.g., clay. In this study, we developed an effective way to avoid this problem with a thin-carbon-film deposition to the particle surface. Here, the results of nanoscale chemical analysis of weathered-biotite clay particles containing Cs are shown.
In Fig.1-39(a), a clear Cs-distribution image was obtained for a clay mineral about several microns in size. We found that Cs was not localized at the particle surface. In addition to the information on particle identification and element distribution, the chemical state of Cs at a specific position indicated by a red full-circle could be visualized in Fig.1-39(b). We found that the Cs chemical state is similar to that of CsNO3. The presence and distribution of Fe3+ were also revealed. The real-space information on the chemical states would deepen our understanding of Cs-adsorption mechanism.
Nanoscale visualization of chemical states can be applied to nuclear-research fields such as analysis of decontamination soil and mock samples of fuel debris contributing to decommission of the reactor. Our new approach to analyzing insulating materials using SR-PEEM is expected to be used for the development of many advanced materials in nanotechnology, environmental, and new-energy studies.

