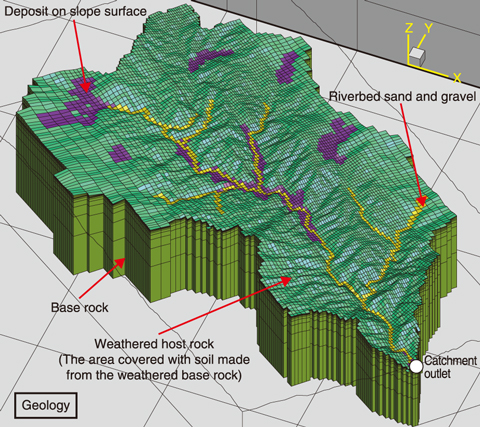
Fig.1-28 3-D-structure of the studied area
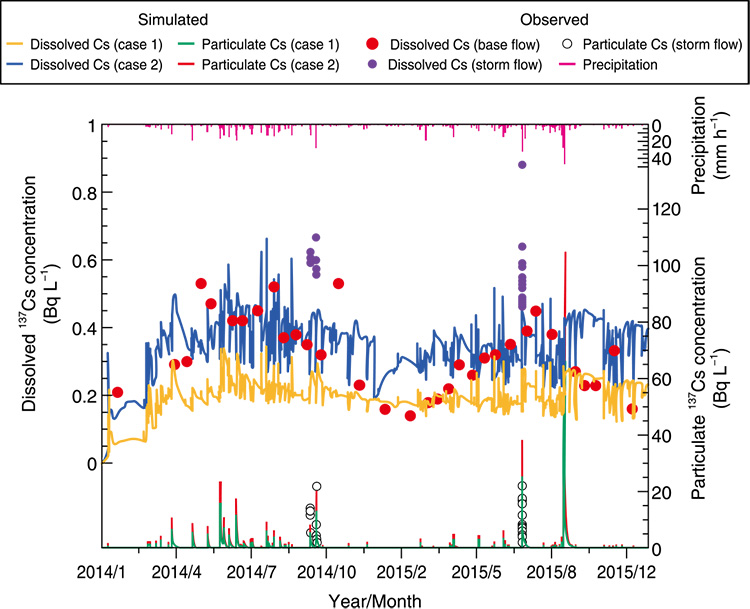
Fig.1-29 Simulated dissolved and particulate 137Cs concentration in river water
Approximately 70% of the radiocesium (hereafter 137Cs) fallout to terrestrial area from the TEPCO’s Fukushima Daiichi NPS accident occurred in forest areas where decontamination work has not yet been done. Studying the behavior of 137Cs from the forest to stream and river waters is thus required to understand how the 137Cs concentration in agricultural products and freshwater ecosystems have changed. This includes understanding the discharge of 137Cs adsorbed by soil particles (i.e., particulate 137Cs) but also bio-available 137Cs in water (i.e., dissolved 137Cs). Therefore, water, sediment, and 137Cs transport were simulated using a watershed model of the 99% forest area (in Minamisoma city and Namie town, Fig.1-28), upstream of the Ohta River catchment, in GETFLOWS. The simulated results were then compared with observed dissolved 137Cs upstream discharge behavior.
The reproducibility of models related to water and sediment discharge at the discharge point were first confirmed, as shown in Fig.1-28. The partitioning of the 137Cs inventory between the particulate and aqueous phases occured instantaneously and was modeled with the distribution coefficients (Kd). In the first simulation (case 1), the Kd was based on the partitioning between the dissolved and particulate 137Cs measured from river water samples taken at simulation area. In the second simulation (case 2), the Kd dataset was more realistic in its modeling 137Cs absorption to the particulates, as absorption occurs more readily to the finer than coarser grades.
The simulated dissolved and particulate 137Cs in the river water from January 2014 to December 2015 at the discharge point is shown in Fig.1-29. The case 1 simulation results (![]() ) underestimated the observed dissolved 137Cs concentration under base flow conditions (0.14-0.53 Bq L-1, mean: 0.32 Bq L-1); however, the case 2 simulation results (
) underestimated the observed dissolved 137Cs concentration under base flow conditions (0.14-0.53 Bq L-1, mean: 0.32 Bq L-1); however, the case 2 simulation results (![]() ) matched the observations more closely (mean: 0.36 Bq L-1). Thus, this model was determined to accurately reproduce the mean dissolved 137Cs concentration under base flow conditions.
) matched the observations more closely (mean: 0.36 Bq L-1). Thus, this model was determined to accurately reproduce the mean dissolved 137Cs concentration under base flow conditions.
However, neither the seasonal variability in the base flow of the dissolved 137Cs concentration (![]() ), nor the peaks in concentration that occurred during storms (
), nor the peaks in concentration that occurred during storms (![]() ), could be reproduced with the simulation parameters used. As well as the results of field monitoring in river, these discrepancies may have been caused an additional input of 137Cs to rivers by the leaching of organic matter in forest litter, i.e., its process is considered to be other mechanism except for the equilibrium between dissolved and particulate 137Cs.
), could be reproduced with the simulation parameters used. As well as the results of field monitoring in river, these discrepancies may have been caused an additional input of 137Cs to rivers by the leaching of organic matter in forest litter, i.e., its process is considered to be other mechanism except for the equilibrium between dissolved and particulate 137Cs.
Future work will aim to verify and improve this simulation method by further field monitoring and experimental work to reveal the mechanisms of the dissolved 137Cs leaching process from forest litter to stream and river waters.

