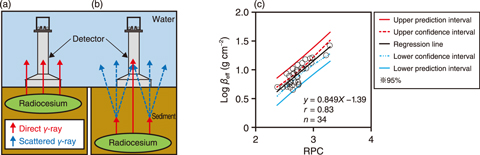
Fig.1-30 Measuring the gamma-ray spectra of surface sediment
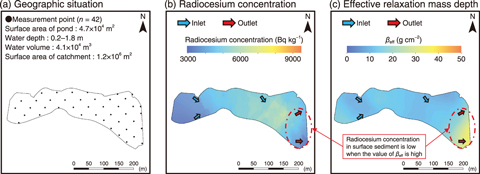
Fig.1-31 Applying the model to a real pond
Knowing the distribution of sediment-associated radiocesium at the bottom of a pond is necessary for understanding how to decontaminate, dredge, and restart agricultural activities. The vertical distribution of radiocesium must be understood to dredge the sediment effectively. However, obtain these data is difficult and time-consuming. A radiation measurement method using a waterproof detector has thus been developed to investigate the distribution of sediment-associated radiocesium at the bottom of a pond rapidly and easily. However, this method only allows for the measurement of the radiocesium concentration in surface sediment. Therefore, a method to estimate the vertical distribution of sediment-associated radiocesium was developed to focus on the characteristics of the gamma-ray spectrum (scattered and direct) obtained from the surface sediment at a pond bottom (Fig.1-30).
It is estimated that the contribution ratio of direct and scattered gamma-ray is varied with the depth from which radiocesium is emitted. To confirm this, 253 data points regarding the characteristics of the gamma-ray spectrum and vertical distribution of radiocesium in 64 pounds of sediment samples in the Fukushima Prefecture were collected. A waterproof NaI(Tl) scintillation detector (A-Sub: Hitachi, Ltd.) was dropped into the pond and then used to measure the gamma-ray spectrum for 2 min. The sums of counting rate in scattered peak (150-250 keV) and that in photo peak (550-850 keV) based on the obtained gamma-ray spectra were calculated, respectively. The ratio of sum of counting rate in scattered peak to that in photo peak (RPC) was calculated. Core sediment samples (5-40 cm) were also sampled using a sediment sampling tube. The samples were divided into 5 cm intervals. The parameter regarding the vertical distribution of radiocesium (effective relaxation mass depth (βeff g cm-2)) was calculated based on the measuring result of samples using Ge semiconductor detector.
Positive correlations between RPC and βeff were observed (Fig.1-30(c)), indicating that the vertical distribution of sediment-associated radiocesium can be estimated via this detector by focusing on the characteristics of gamma-ray spectrum. Forty-two gamma-ray spectra were measured to cover the entire pond (Fig.1-31(a)), allowing a map of the radiocesium concentration in the surface sediment (Fig.1-31(b)) and βeff (Fig.1-31(c)). As a result, the three-dimensional distribution of sediment-associated radiocesium can be more easily determined using this in-situ measurement than conventional methods. These results will further dredging and restarting the agricultural activities of ponds in the evacuation zone.

