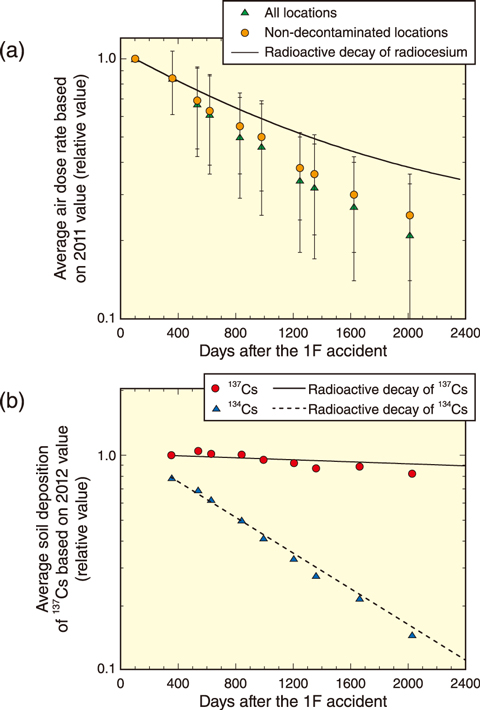
Fig.1-33 Temporal changes of air dose rate and radiocesium soil deposition based on the fixed-points survey (relative value)
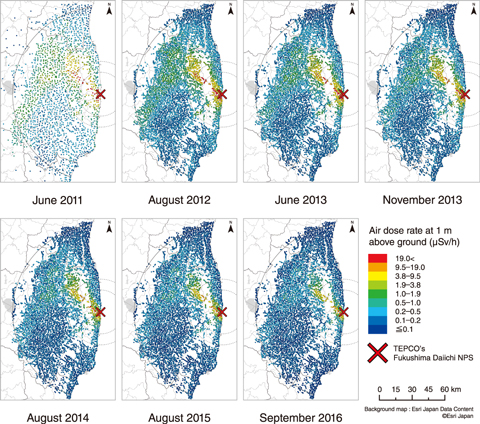
Fig.1-34 Air dose rate distribution maps based on the fixed-point survey since 2011 (including contribution of natural radiation)
After the accident at the TEPCO’s Fukushima Daiichi NPS (1F), the government announced a policy to create radiation and radioactive materials distribution maps based on land monitoring. In June 2011, maps of the air dose rate distribution were completed and disseminated based on measurements taken from approximately 2200 locations (fixed-point survey) in Fukushima Prefecture mainly within an 80 km-radius area from the 1F using survey meters at non-paved and undisturbed areas in cooperation with universities, research institutes, etc. From 2012 to 2016, the fixed-point survey continued and was expanded by increasing the number of measurement locations to approximately 6500, mainly within the 80–km area surrounding the 1F. The average air dose rate from the fixed-point survey decreased annually, as shown in Fig.1-33(a). Maps of the air dose rate distribution generated from the observed data confirm that areas with relatively high dose rates are shrinking (see Fig.1-34). Furthermore, the rate of decrease of the dose rate was greater than the rate due to the radioactive decay of radiocesium considering both 134Cs and 137Cs. If the air dose rate decreases according to the radioactive decay, in 2016 it will be approximately 37% of the value in June 2011. However, the air dose rate decreased further, to approximately 24% of the original value at non-decontaminated locations. In addition, the average air dose rate at all locations, including the decontaminated locations, decreased to approximately 19% of the original value; thus, the average air dose rate has been reduced to about half of the expected value in the case of only radioactive decay. This is due in part to human activities including decontamination work.
The amount of radioactive material deposited on the soil (soil deposition) in open spaces with little artificial disturbance was measured in situ using portable germanium semiconductor detectors each year since 2012 across approximately 380 locations within an 80–km area surrounding the 1F to analyze the temporal changes. As shown in Fig.1-33(b), the average soil deposition of 134Cs and 137Cs measured at the non-decontaminated locations decreased following the trend of the corresponding radioactive decay.
This seemed to contradict the lower air dose rate found at the non-decontaminated locations than the radioactive decay of radiocesium. The excess reduction of the air dose rate over the radioactive decay was 0.65 (= 0.24/0.37). When the slight migration of radiocesium in the depth direction during this period is taken into consideration, the analysis results show that the air dose rate decreased by approximately 0.7 times due to the radiation shielding effect of soil. Thus, the air dose rate decreases faster than the soil deposition decrease rate because the gamma rays are blocked by the penetration of radiocesium in the soil in the depth direction, not by the horizontal migration of the radiocesium.
This research is part of the results by consignment project conducted on “Aggregation of radioactive material distribution data associated with TEPCO Fukushima Daiichi Nuclear Power Station accident in FY2016”, supported by the Nuclear Regulation Authority (NRA), Japan.
(Satoshi Mikami)

