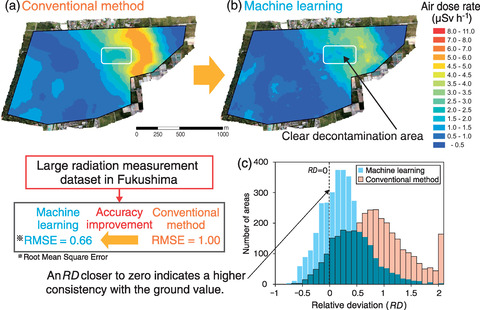
Fig.1-27 Air dose rate map converted by machine learning
We have been performing airborne radiation surveys (ARSs) using unmanned aerial vehicles (UAVs) for environmental radiation monitoring and nuclear disaster prevention since TEPCO's Fukushima Daiichi NPS (1F) accident in 2011. ARSs allow measurements to be taken quickly across a wide area where people cannot walk. However, the analyzed data has unavoidable uncertainty when converting ARS data to the ambient dose equivalent rate (i.e., air dose rate) at 1 m above ground level (AGL). In the conventional conversion method, the ground topography is assumed flat, and the air dose rate distribution is assumed uniform. When conditions deviate from these hypothetical conditions, the calculated air dose rates can be highly inaccurate. Although inverse analysis has been demonstrated to be effective, this method requires extensive calculation times. Therefore, we developed an analysis method for real-time and exact analysis using an artificial neural network (ANN), which is a machine-learning system.
The large amount of radiation data that has been obtained around 1F (big data) was applied as training data while constructing the ANN. This training data, containing 37936 data sets, comprised ARS data from an unmanned helicopter and ground-based survey data measured using a backpack survey meter. The ANN was constructed using NeuralWorks Predict (NeuralWare, Carnegie, U.S.A.). The data sets not contained in the training data were converted to ground air dose rates at 1 m AGL to use as test data; the error (RMSE and RD) between the converted data and the ground-based survey data was then calculated. The RMSE and RD were used as an index of reenactment improvement. Comparing the dose rate distribution maps converted by the conventional method (Fig.1-27(a)) and the machine-learning method (Fig.1-27(b)), the dose-rate distribution of the proposed method was sharper in the decontaminated areas. The RMSEs of the conventional and proposed methods were 1.00 and 0.66, respectively. Additionally, the RD of the proposed method approached zero, as shown in Fig.1-27(c). Therefore, the proposed machine-learning method was more accurate than the conventional method. Further, the optimum parameters were successfully from the big data. In the example shown in Fig.1-27, the inverse problem analysis method required several hours, whereas the proposed method reproduced the dose rate map better than conventional methods in only a few minutes.
Future efforts will aim to improve the quality of conversion by additional measured and simulated data in difficult-to-approach areas, such as the forest and farmland.
This research was part of the joint research with Nagoya University.
(Miyuki Sasaki)

