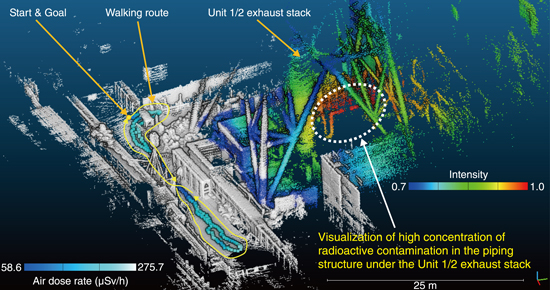
Fig.1-21 Three-dimensional (3D) map visualizing the air dose rate and highly contaminated region near Unit 1/2 exhaust stack at 1F
Eleven years have passed since the accident at TEPCO’s Fukushima Daiichi NPS (1F), but areas with high dose rates still remain inside the 1F building where it is difficult for workers to enter and work for long hours. It is extremely important to understand the distribution of radioactive contamination in these work environments to reduce the exposure of the workers to radiation and to develop work plans.
Against this background, we devised an integrated Radiation Imaging System (iRIS) that visualizes the distribution of radioactive contamination in the work environment in three dimensions.
We have developed a system that can scan the contamination distribution in the work environment at once while moving. This system combines combining a Compton camera, a type of gamma-ray imager, and a 3D-LiDAR–based SLAM (Simultaneous Localization and Mapping) device. This demonstration test was conducted in the vicinity of the exhaust stack of Unit 1/2 of the 1F with the cooperation of TEPCO. The lower part of the exhaust stack has a high dose rate, making it difficult for workers to enter and stay for a long period of time. Conventional fixed-point measurement (two-dimensional imaging) using the Compton camera requires the measurement of the target region from multiple viewpoints to identify the location of the radioactive hotspot, and thus it is necessary to repeatedly move the Compton camera and take measurements.
In contrast, with iRIS, data acquisition can be completed in less than 5 min by continuously measuring the radioactive contamination distribution as the operator walks along a passageway with a relatively low dose rate and without entering the lower part of the exhaust stack. Furthermore, by displaying the images of the radioactive hotspot as acquired by the Compton camera in color on a 3D environment model of the work environment acquired using the SLAM device, we successfully plotted a 3D map visualizing the hotspot on the pipe below the exhaust stack (Fig.1-21). Simultaneously, the dose rates along the trajectory of the operator can be displayed on the 3D map by combining the measurement data acquired with the survey meter. In the future, we will conduct demonstration tests inside the reactor building of the 1F.
The results of this study have been introduced in several debriefing sessions and journal articles*1, 2 after the press release.
(Yuki Sato)
*1 Sato, Y., Development of an integrated Radiation Imaging System, Inspection Engineering, vol.27, no.5, 2022, p.9–15 (in Japanese).
*2 Sato, Y., 3D Visualization of Radioactive Contamination Using an integrated Radiation Imaging System (iRIS), Isotope News, no.781, 2022, p.19–23 (in Japanese).

